
This post is adapted from ARtillery Intelligence’s latest report, Mobile AR Usage & Consumer Attitudes. It includes some of its data and takeaways. More can be previewed here and subscribe for the full report.
How do consumers feel about mobile AR? Who’s using it? How often? And what do they want to see next? More importantly, what are non-users’ reasons for disinterest? And how can app developers and anyone else building mobile AR apps optimize product strategies accordingly?
These are the questions we set out to answer. Working closely with Thrive Analytics, ARtillery Intelligence wrote questions to be presented to more than 3000 U.S. adults. The results are in and analyzed in the latest ARtillery Intelligence report. Today we dive into top content categories.
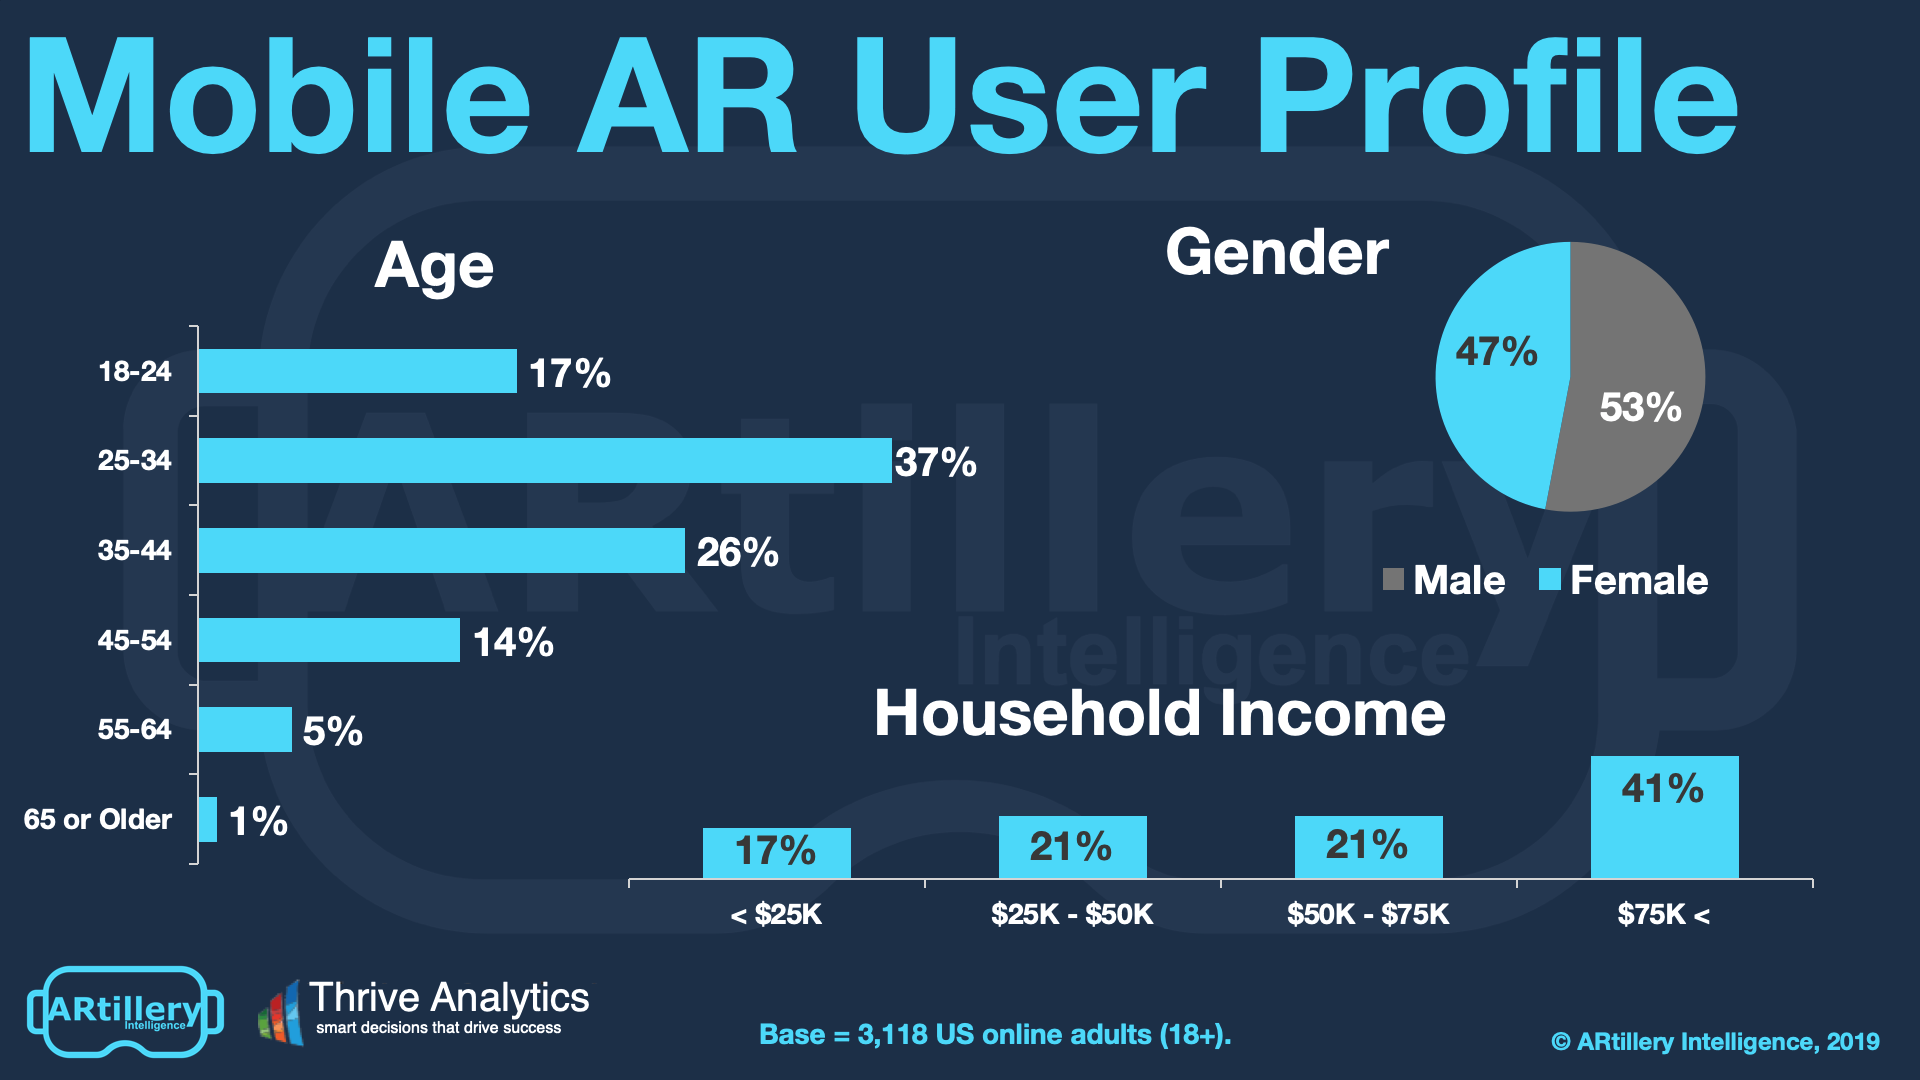
But to first add context to survey findings throughout this report, who’s answering the questions? It includes more than 3000 U.S. adults. Going deeper into demographics and psychographics, AR users break down as shown below. More detail and segmentation are available in the full report.
As the data show, the segment of AR users spans a wide range of U.S. adult consumers. Gender breaks down fairly evenly, while age and income levels skew towards attractive demographic groups. That includes buying-empowered age groups (25-34), and high-income homes ($75K+).
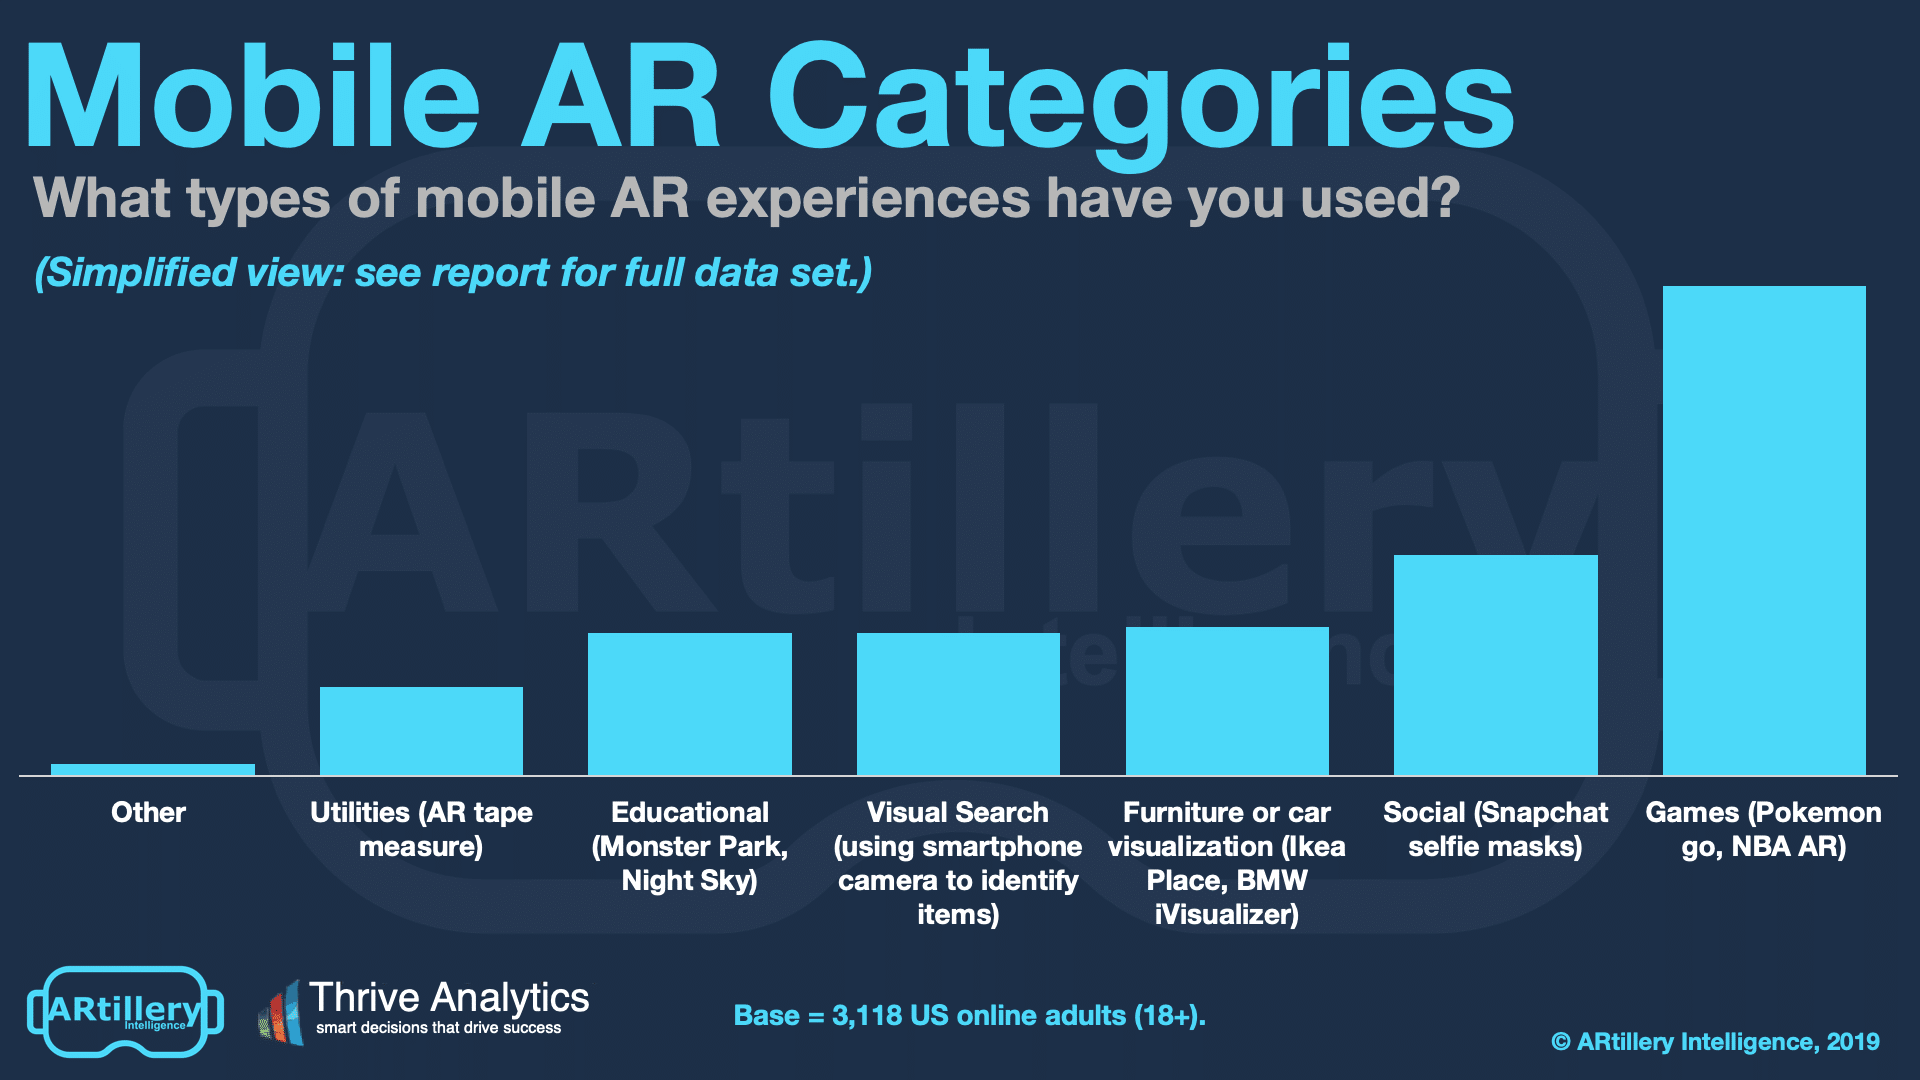
Drilling down, what content categories are mobile AR users consuming most? As we’ve examined the most popular flavors of AR so far are Pokémon Go (PGO) and Snapchat Lenses. So naturally, our survey results peg gaming (82 percent) and social (37 percent) as top categories.
As a matter of process and methodology, we should mention here that we explicitly name these experiences as examples when asking survey respondents about the corresponding categories. In order to avoid false positives, it’s always good to be very specific in survey questionnaires.
While we’re at it, we’ll address another looming question: Are Pokémon Go and Snapchat Lenses AR? Many purists argue that they aren’t. Our take is that any graphical, audible or geographically-contextual augmentation (as is the case with PGO) fits a broad definition of “augmented reality.”
As for the factors that have caused this user traction, Pokemon Go has an optimal mix of game mechanics, leveling up, challenging play and contextual augmentation. The latter involves geographically relevant game elements, which create a sense of discovery and accomplishment.
For social AR Lenses, success factors include simplicity and virality. There are fun elements, amplified by social-graph driven network effect and virality. For example, Snapchat and Facebook can reach television-sized audiences such as 700 million lenses viewed on New Year’s Eve.
The thing to watch next is Facebook’s growth in social lenses. Though Snapchat enjoys an early lead, Facebook’s operational scale and global installed base make it more likely to pull ahead. That includes distribution points like the News Feed, Messenger and the mighty Instagram.
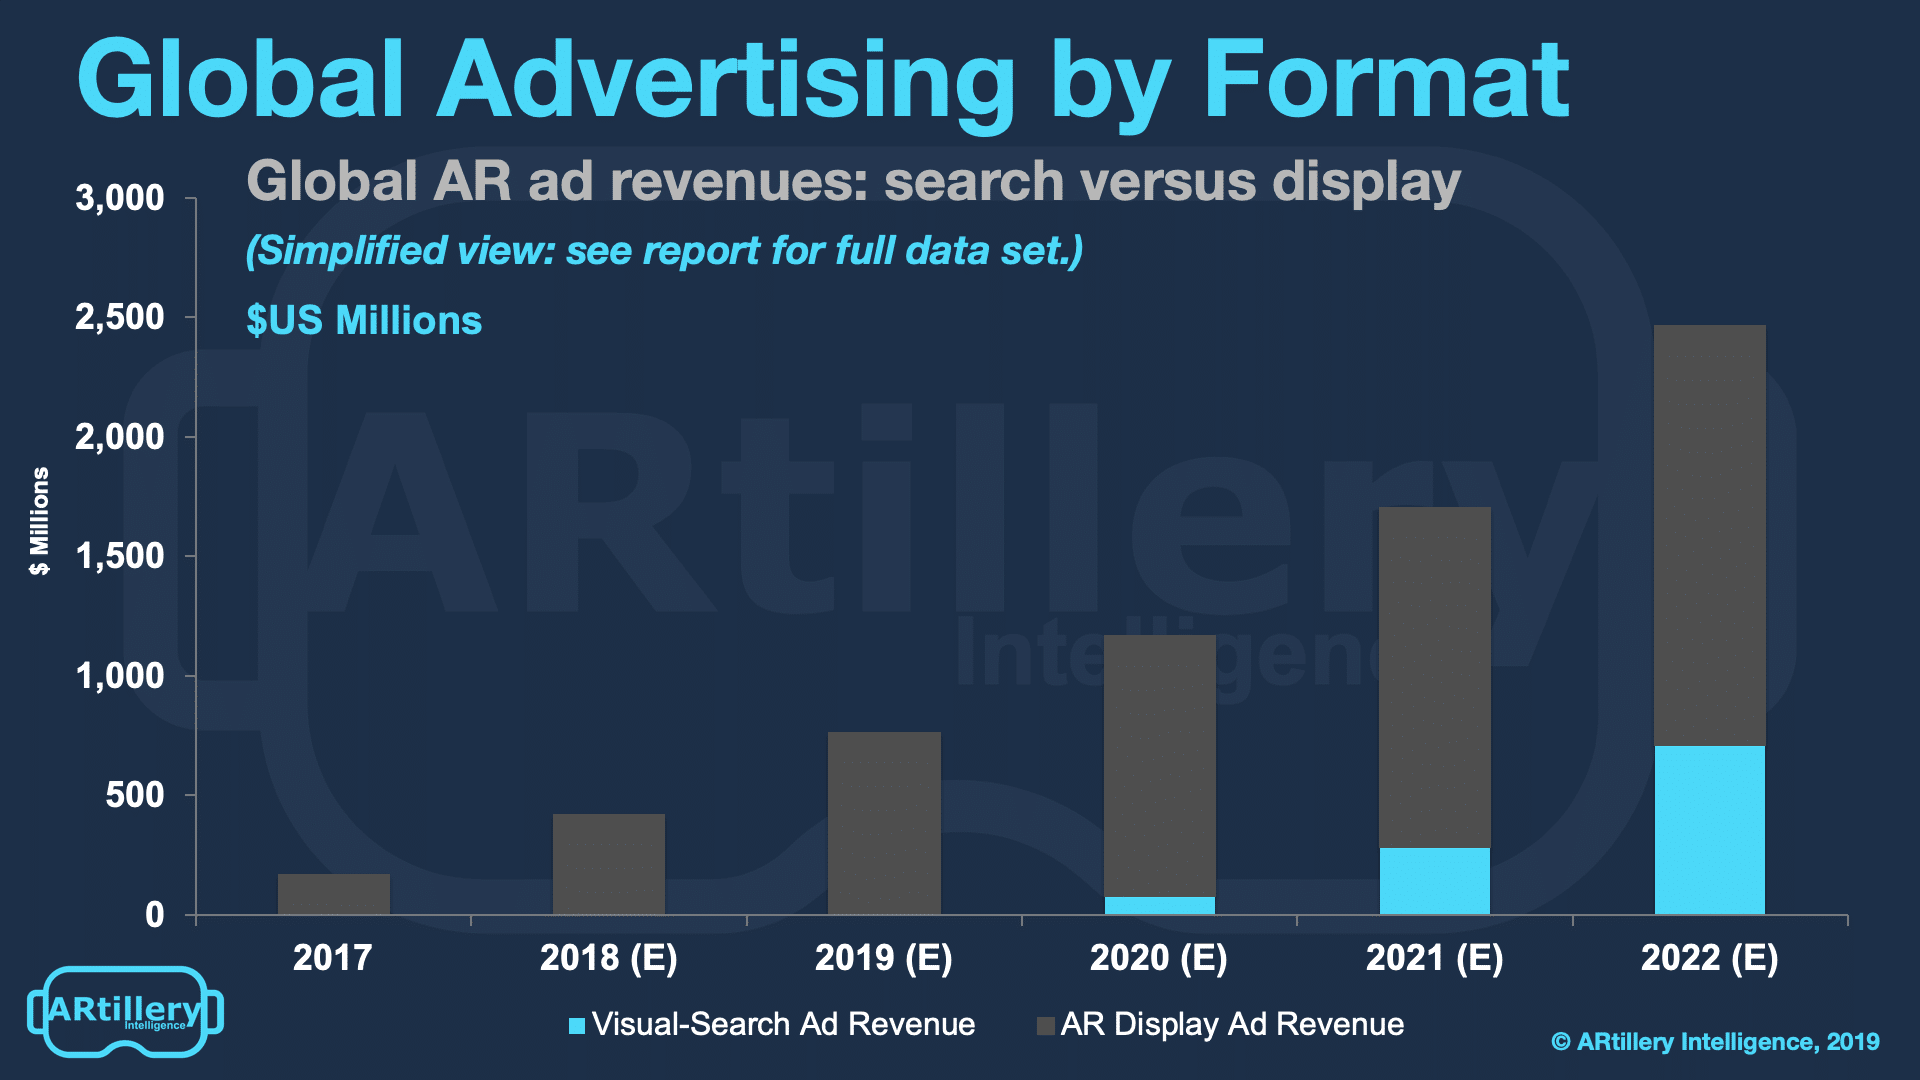
The motivating factor for these players is high engagement and repeat use, validated by their own numbers and these survey figures. That not only keeps users in their walled gardens but directly monetizes: Branded lenses drove about $418 million last year, growing to $1.8 billion in 2022.
To acknowledge other categories, product visualization (25 percent) and visual search (24 percent) offer users value. Though less frequent, product visualization apps like IKEA Place and BMW’s iVisualizer can save consumers time and headaches by enabling informed purchases.
Visual search likewise provides utility in letting users “search what they see,” by pointing the camera at real-world items. As shown in Google Lens, visual search is not only valuable to users but has commercial potential. Google views it as another input to cultivate monetizable search.
But more importantly, visual search has the potential to be an “all-day” use case with versatility and broad application. The ability to pull out your phone and identify items – commercial or not – can happen in lots of daily contexts. So it has the potential for a key AR success factor: frequency.
We’ll pick up there in the next section, examining how often AR users engage, and how that frequency maps to content categories like those examined above.
See more details about this report or continue reading here.
For deeper XR data and intelligence, join ARtillery PRO and subscribe to the free AR Insider Weekly newsletter.
Disclosure: AR Insider has no financial stake in the companies mentioned in this post, nor received payment for its production. Disclosure and ethics policy can be seen here.