
This post is adapted from ARtillry’s latest Intelligence Briefing, VR Usage & Consumer Attitudes. It includes some of its data and takeaways, including original survey research. More can be previewed here and subscribe for the full report.
How do consumers feel about VR? Who’s using it? What devices and apps do they prefer? And what do they want to see next? Perhaps more important, what are non-users’ reasons for disinterest? And how can VR developers optimize product strategies accordingly?
These are key questions at VR’s early stages that we set out to answer. Working closely with Thrive Analytics, ARtillry Intelligence wrote questions to be presented to more than 1,900 U.S. adults in Thrive’s consumer survey engine. And we’ve analyzed the results in a narrative report.
This follows last year’s first installment of the report. Wave II of the research now emboldens our understanding and brings new insights and trend data to light. There are also notable parallels in these results to our sister report on AR adoption published in April.
See It To Believe It
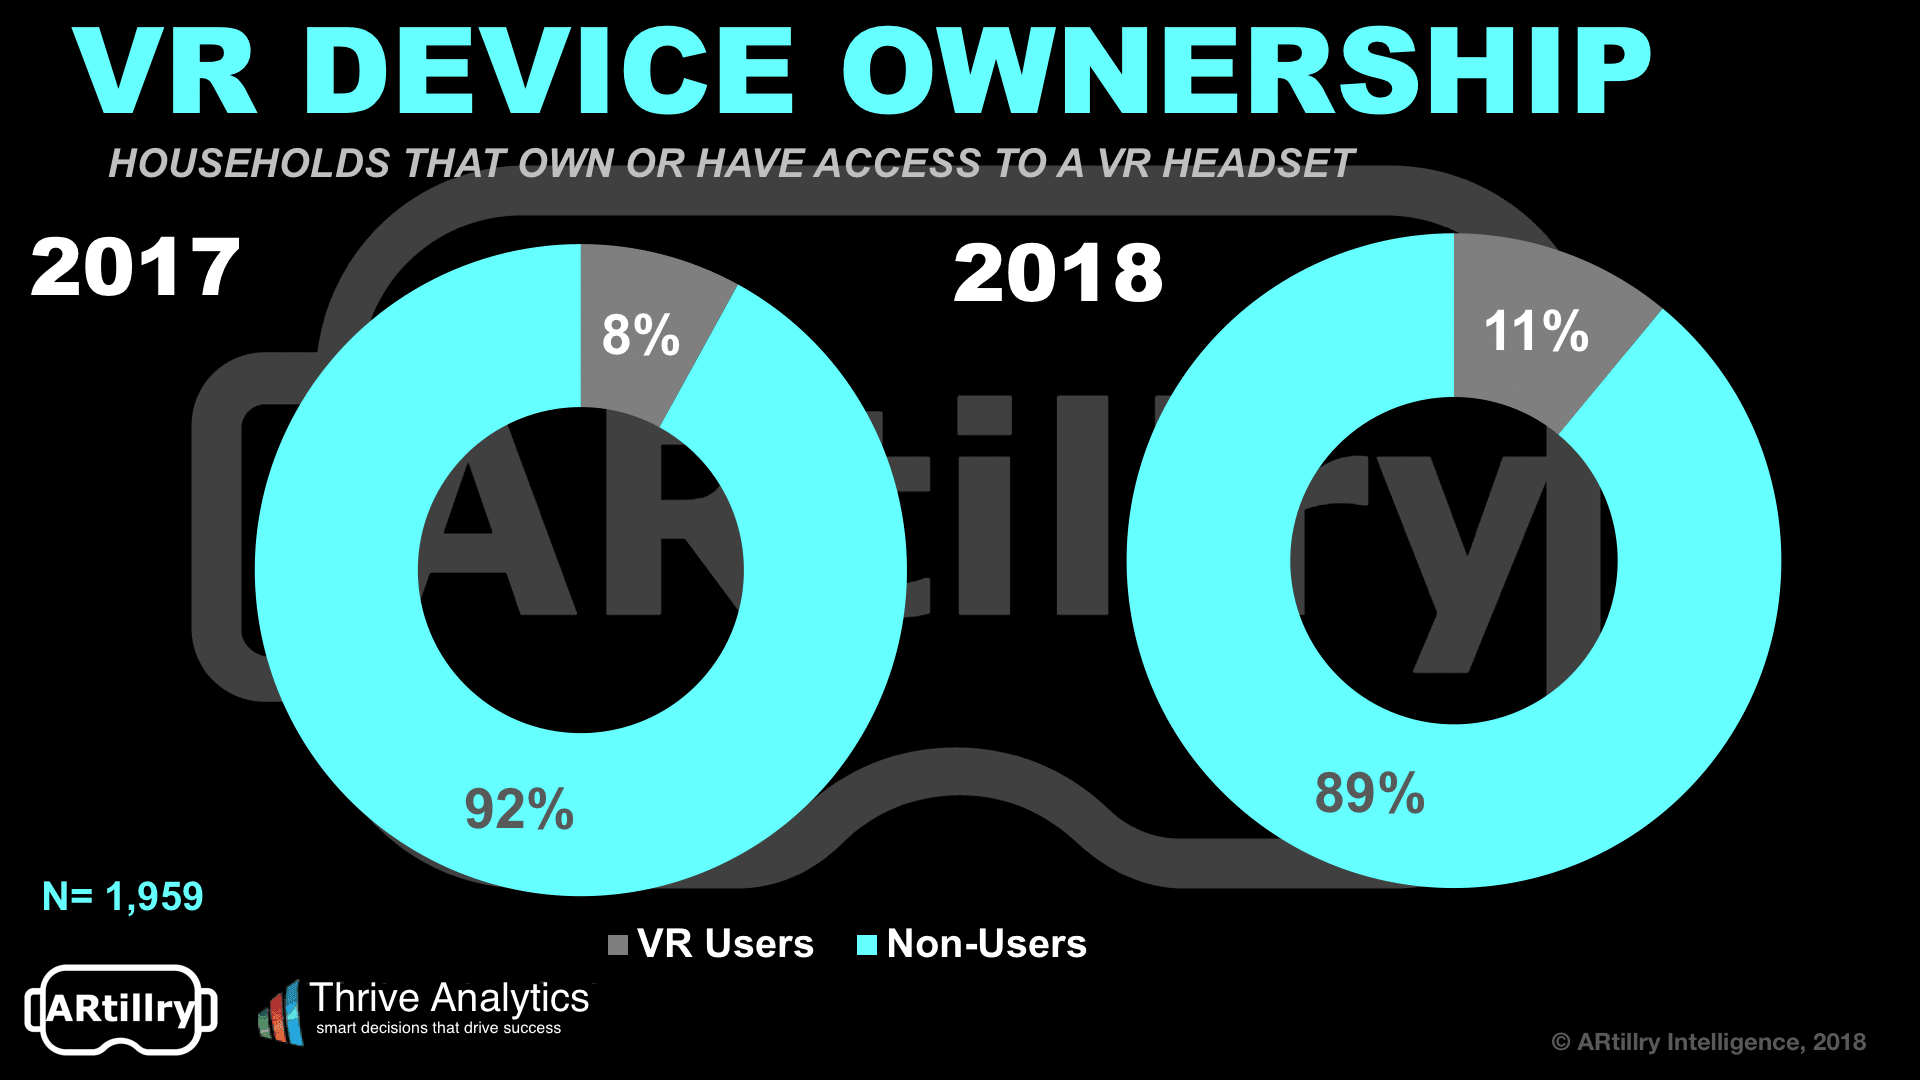
So what did we find out? At a high level, eleven percent of consumers surveyed have bought or used a VR headset, up from eight percent in 2017. More importantly, VR users indicate high levels of satisfaction: 65 percent of respondents report moderate or extreme satisfaction.
However, it’s not all good news: Non-VR users report relatively low likelihood of VR adoption – 31 percent, down from 41 percent in 2017 – and explicit lack of interest. This downward trend is concerning for VR but isn’t surprising given the dip in excitement we’ve anecdotally observed.
Moreover, the disparity between current-user satisfaction and non-user disinterest underscores a key challenge for VR: you have to “see it to believe it.” In order to reach high satisfaction levels, VR has to first be tried. This presents marketing and logistical challenges to push that first taste.
Put another way, VR’s highly visual and immersive format is a double-edged sword. It can create strong affinities and high engagement levels. But the visceral nature of its experience can’t be communicated to prospective users with traditional marketing such as ad copy or even video.
The same challenge was evident in our corresponding AR report, but mobile AR’s barriers to adoption are lower. This is nonetheless a common challenge for immersive technologies. It will take time, acclimation and price reductions before they reach more meaningful penetration.
Content is King
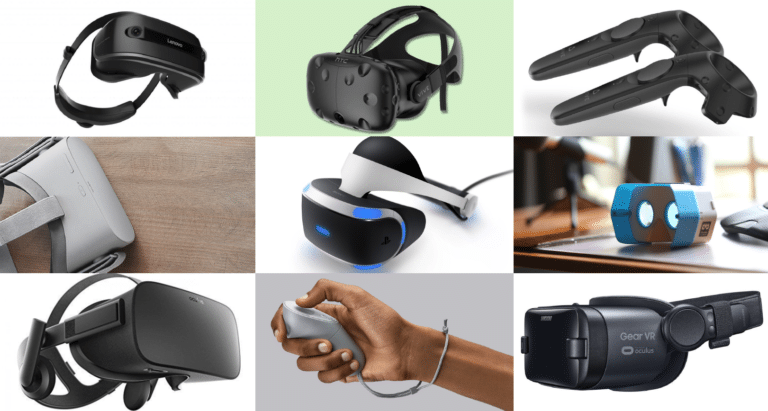
As for headset breakdowns, Gear VR is the most popular, followed by PSVR. But GearVR is notably trending downward, which we believe is due to price reductions among tier-1 headsets and added competition this year from Windows Mixed Reality and standalone headsets.
Speaking of standalone VR, it will be an important “gateway drug” to push past the adoption challenges above. It’s cheaper, lighter, untethered and having more frictionless session launches. The poster child is Oculus Go, though its launch came after these survey results were fielded.
Still, we believe future waves of this survey will report strong penetration and satisfaction for Oculus Go. It has a solid spec sheet and the price is right due to Oculus’ aggressive price competition. $200 is the price point under which adoption inflects in these survey results.
Another top survey sentiment was the importance of content. And Oculus Go has more than 1000 apps out of the gate because it’s backwards compatible with Gear VR’s library. We’ll also see the gravitational pull of developers to Oculus Go, incentivized by its growing installed base.
Other notable trending includes Rift gaining ground on Vive, which supports evidence we’ve seen elsewhere in the market. It’s also due to Oculus’ investments in content creation and, again, its aggressive price competition that’s pursuant to a longer-term platform strategy.
Meanwhile, there are lots of other findings and strategic takeaways from these survey results. We break it down in the latest ARtillry Intelligence Briefing, through the lens of consumers’ explicit sentiments, actions and desires. There’s a lot to unpack, as we’ll do in the coming weeks.
Meanwhile, preview the report or subscribe to access the entire thing.
For a deeper dive on AR & VR insights, see ARtillry’s new intelligence subscription, and sign up for the free ARtillry Weekly newsletter.
Disclosure: ARtillry has no financial stake in the companies mentioned in this post, nor received payment for its production. Disclosure and ethics policy can be seen here.