 Data Dive is AR Insider’s weekly dive into select spatial computing figures. Running Mondays, it includes data points and strategic takeaways. For an indexed library of data, reports, and multimedia, subscribe to ARtillery Pro.
Pokémon Go continues to defy gravity. A common course for mobile games is to flame out as a novelty and challenging gameplay recede. But Pokémon Go marches on. Though generalist media coverage has moved on to other shiny objects, the game is now stronger than ever.
That includes reaching $3.6 billion in lifetime revenue and its highest full-year revenue to date in 2019. As ARtillery Intelligence examined in a recent report, this results from a combination of replayable game mechanics and thoughtful updates to keep players active, even in a pandemic.
To validate all of this and go a bit deeper, the folks at the Business of Apps recently assembled a massive repository of all the available data on Pokemon Go’s usage. As the focus of this week’s Data Dive, you can see our strategic takeaways below and the original data collection here.
Sustained Momentum
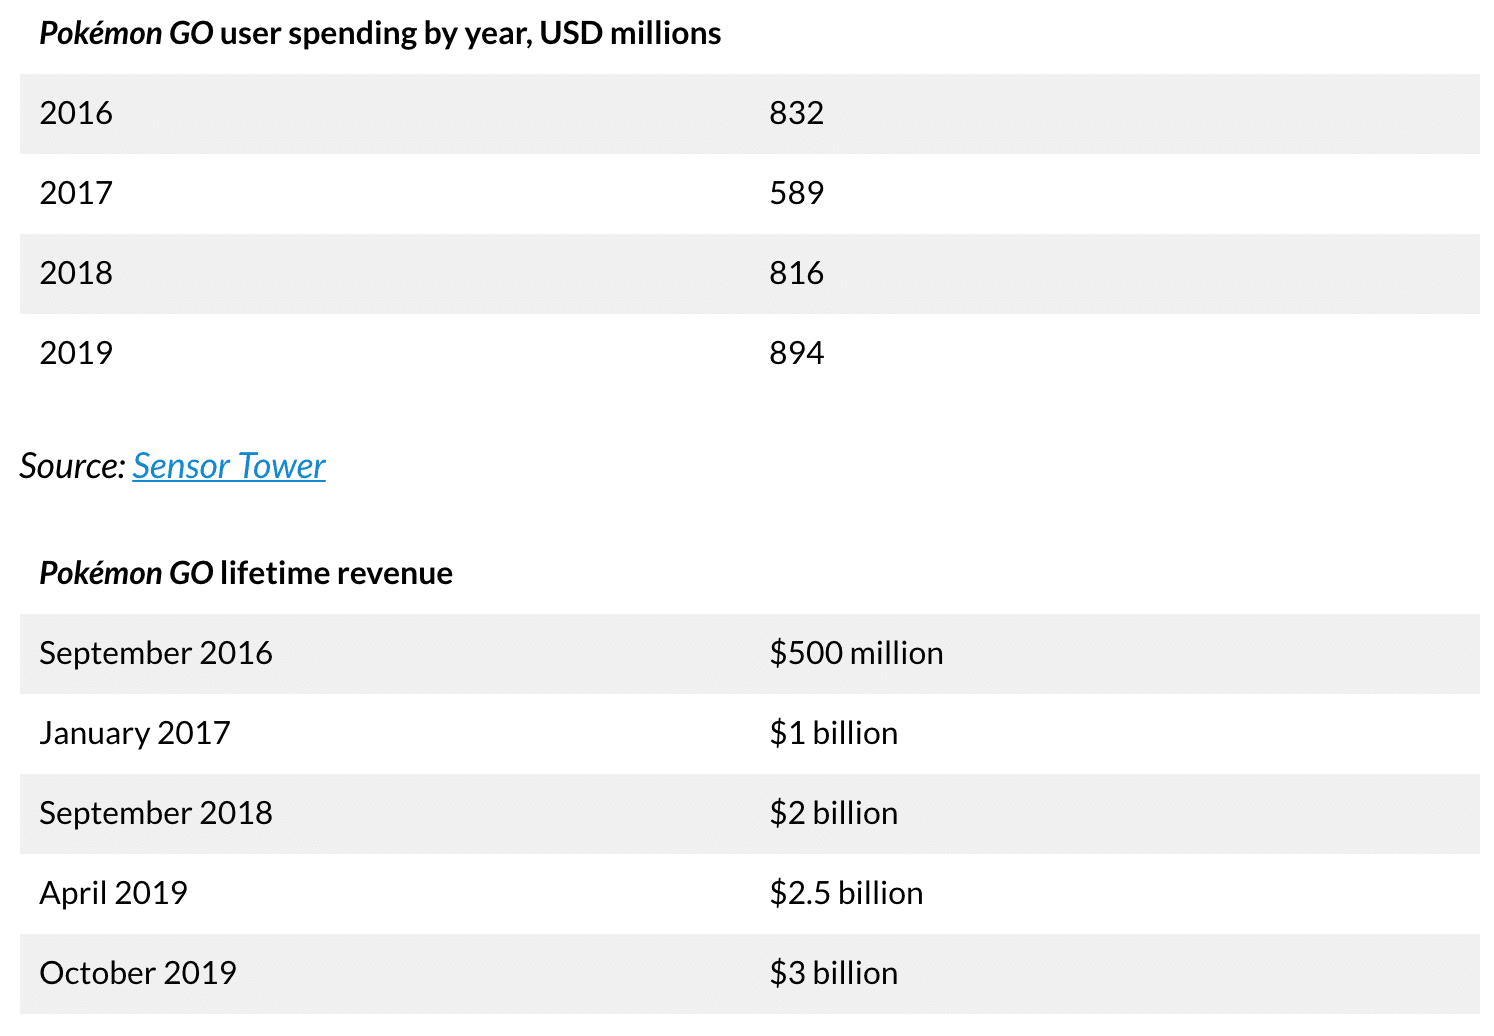
So what does the data collection reveal? It’s too large to replicate in full so we’ll extract highlights. Starting at the top, the game’s 2019 full-year statistics are most notable. Again, it set new high water marks with $894 million in annual player spending and $3.6 billion in cumulative revenue.
That momentum carried into 2020 with weekly revenue in the $10 million to $17 million range. This ticked steadily upwards then dipped a bit in the pandemic’s early days. But it then notably bounced back as mobile gaming is a Covid-advantaged sector… and Niantic acted fast.
Now, the game is ranked seventh among iOS titles in monthly revenue. Statista-aggregated estimates indicate $438,729 in June revenue, behind mobile gaming giants Roblox, Fortnite and Candy Crush. More about its Covid-era performance will be clearer in the coming months.
Niantic’s valuation has tracked to this growth (and to its funding rounds), ticking up from 150 million in February 2016 (pre-Pokémon Go) to $3.65 billion in July 2016 (coinciding with the PGO’s launch) to $4 billion in January of 2019 (when it secured $245 million in Series C funding).
Data Dump
We’ll close by leaving you with a lightning round of Pokemon Go statistics… and with a disclaimer. These figures are directionally useful but should be viewed with the knowledge that they’re mostly third-party extrapolated figures versus first-party data from Niantic. That said, here’s the “data dump.”
— 55 million Pokémon GO downloads in 2019 (Sensor Tower)
— The US accounted for 19% of Pokémon GO downloads over 2019 (10 million, up from 16% in 2018), Brazil for 10% (5 million), and India for 6% (3 million) (Sensor Tower)
— 69% (38 million) of 2019 Pokémon GO downloads on Android, and the remaining 31% (17 million) iOS (Sensor Tower)
–US was top country for Pokémon GO revenue in 2019, contributing $335 million – or 38% of the total. Japan was second, with $286 million (32%), followed by Germany, with $54 million (6%) (Sensor Tower)
–In both 2017 and 2018, the US accounted for 33% of Pokémon GO revenue, while Japan’s share increased from 25% to 30% (Sensor Tower)
— Google Play accounted for 54% of 2019 Pokémon GO revenue ($482 million), with iOS App Store revenue coming to $412 million (46%) (Sensor Tower)
— Average daily Pokémon GO revenue stood at $4 million, from launch to April 2019 (Sensor Tower)
— Average daily Pokémon GO revenue at $2.5 million per day in 60 days after June 2018 update, up from $1.8 million in trailing 60 day period (Sensor Tower)
–Daily US iOS Pokémon GO revenue estimated at $438,729, as of June 2020 (Statista)
— Pokémon GO was fifth in terms of global mobile game revenue over 2019 (Sensor Tower)
— Pokémon GO was seventh in terms of global mobile game revenue in May 2020 (Sensor Tower)
— 2.7 million attendees of Niantic live events over 2019 (Niantic)
— Pokémon GO accounted for 45% of gameplay time among the top-20 Android games in its first three months of release (App Annie)
— During this early peak, US daily Pokémon GO users numbered 28.5 million; global players at 45 million (Comscore)
— US daily players fell to 5 million by December 2016 (Comscore)
— Reportedly, May 2018 was the best month since the game’s launch, with 147 million monthly active Pokémon GO users worldwide; this is well up on the 60 million reported in June (we don’t have any more recent stats than this) (Eurogamer)
— Pokémon GO 2019 revenue 4.4x greater than Dragon Quest Walk, the second-highest grossing location-based game (Sensor Tower)
— Pokémon GO claimed an 84% market share of downloads of location-based games, and a 92% share in terms of revenue in December 2018 (Deconstructor of Fun)
— 41% of Pokémon GO users are female (Inc.)
— Pokémon GO players had walked a cumulative 23 billion km as of March 2019 (GamesRadar)
— Pokémon GO players walked 8.7 billion km collectively in 2016 – enough to get to the end of the Solar System (Inverse)
— 400,000 Pokémon GO players took part in events in Chicago, Yokosuka, and Dortmund in the summer of 2018 (Niantic)
— Social features were launched in June 2018; by September of that year, 113 million connections had been made, with 2.2 billion gifts sent between friends (VentureBeat)
— In the first month of release, 290 UK crimes were connected with Pokémon GO (BBC)
— A study from Purdue University found that two deaths, 31 injuries, and $500,000 in vehicle damage could be blamed on the game in a single county in Indiana (Purdue University)