

Like many analyst firms, market sizing is one of the ongoing practices of AR Insider’s research arm, ARtillery Intelligence. A few times per year, it goes into isolation and buries itself deep in financial modeling. The latest such exercise zeroes in on mobile AR revenues.
This takes the insights and observations accumulated throughout the year and synthesizes them into hard numbers for spatial computing (see methodology and inclusions/exclusions). It’s all about an extensive forecast model coupled with rigor in assembling reliable inputs.
So what did the latest forecast uncover? At a high level, global mobile AR revenue is projected to grow from $6.87 billion in 2020 to $26.05 billion in 2025, a 30.5 percent CAGR. This sum consists of mobile AR consumer and enterprise spending and their revenue subsegments.
Drilling down, our latest Behind the Numbers installment looks at mobile AR enabling tech. How much is being spent on software that helps brands and media companies create and distribute AR experiences? This precedes the AR ad placement revenue we recently examined.
Picks & Shovels
Jumping right into the numbers, global mobile AR media & marketing enablement revenue is projected to grow from $1.24 billion in 2020 to $5.84 billion in 2025. This is a 36.4 percent compound annual growth rate, and represents one of AR’s most opportune subsectors.
As noted, this category includes software that enables enterprises or developers to create consumer-facing AR such as games, apps, ads, and entertainment. Buyers of this technology (software license or SaaS) include enterprises that develop AR experiences for their customers.
This makes spending on AR media and marketing enablement fall into a category we call B2B2C. It will continue to develop as an opportune AR revenue category, as it represents the proverbial “picks and shovels” that democratize advanced AR experience creation and distribution.
These enablement functions will grow in demand as AR itself does, because they lower barriers to creation and accelerate time to market. This includes AR marketing experience creation platforms such as 8th Wall as well as infrastructure and distribution enablers such as Mawari and VNTANA.
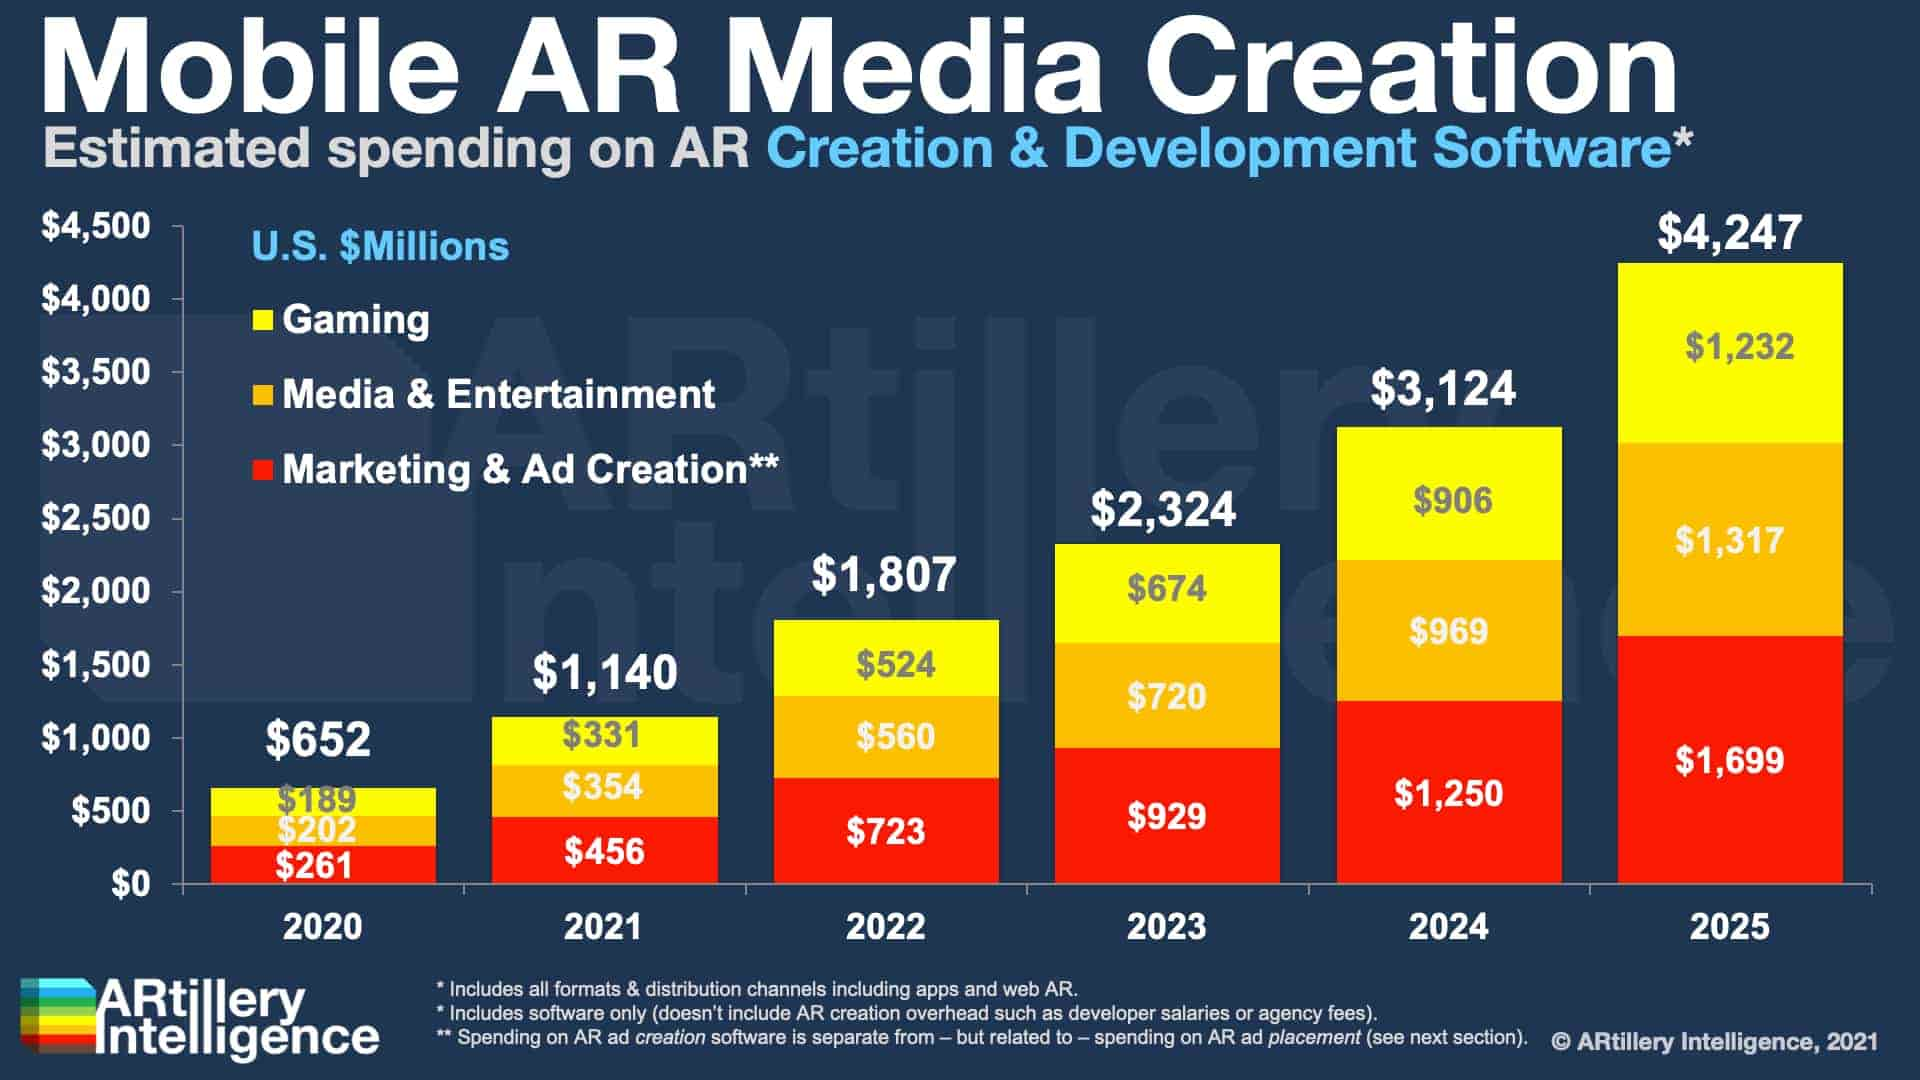
Table Stakes
As for vertical breakdowns in AR enablement software spending, it’s fairly even across media, ad creation* and gaming (see chart above). Advertising creation leads these categories slightly, due to brand marketer AR adoption, and a strong business case with demonstrable ROI.
Spending is also driven by, and correlated to, the growing number of active AR developers and creatives, which will reach an estimated 4.16 million by 2025. This includes a global base of creative pros that could convert to AR, given low-friction tools such as Adobe Aero.
As AR continues to become “table stakes” among brand marketers, this base of AR creative pros will migrate to the medium like osmosis. Beyond hands-on developers and creators, brand marketing departments and ad agencies will increasingly adopt and license AR platforms.
This trend will benefit all AR enablement tools outlined above, but one area we’re particularly bullish on is Web AR. The streamlined use case and relative lack of activation energy (e.g., downloading apps) could make web AR pull ahead as a go-to modality for camera commerce.
We’ll pause there and circle back in the next Behind the Numbers installment to drill down on another spatial computing subsegment.