
This post is adapted from ARtillery Intelligence’s latest report, VR Usage & Consumer Attitudes, Wave III. It includes some of its data and takeaways. More can be previewed here and subscribe for the full report.
How do consumers feel about VR? Who’s using it? What devices and apps do they use? And what do they want to see next? Perhaps more importantly, what are non-users’ reasons for disinterest? And how can VR players optimize product strategies accordingly?
These are key questions that our research arm ARtillery Intelligence set out to answer. Working with Thrive Analytics, they presented questions to more than 3,100 U.S. adults in Thrive’s established survey engine. And they’ve analyzed the results in a narrative report.
This follows similar reports completed over the past two years. Wave III of the research now emboldens the perspective and brings new insights and trend data to light. All three waves represent a collective base of 7,065 U.S. adults for a robust longitudinal analysis.
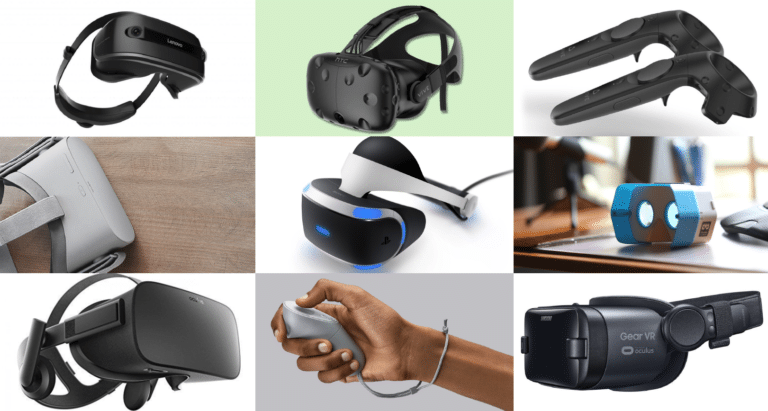
This week, we’ll dive into the breakdown of which headsets consumers are using.
Headset Mindsets
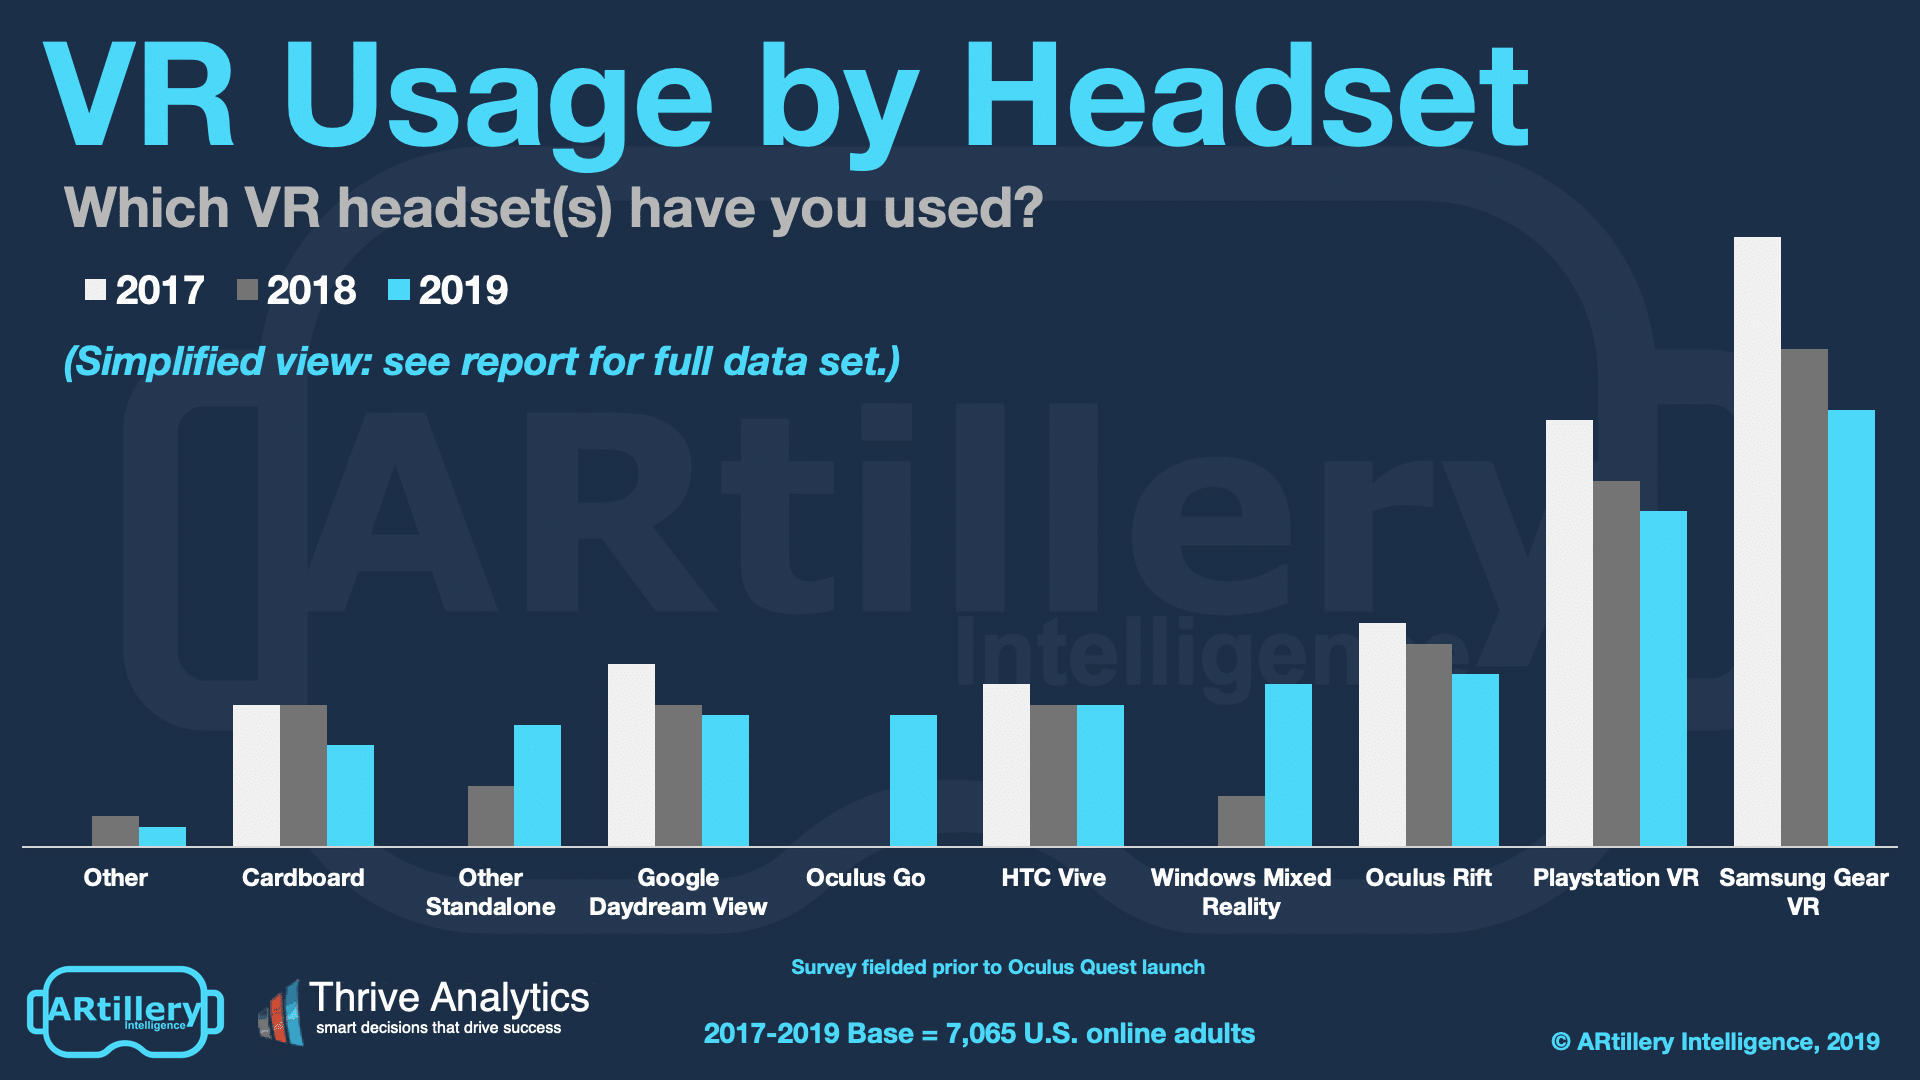
What VR devices are gaining the most traction? Samsung’s Gear VR scored highest in our survey at 43 percent. This is surprising due to the device’s slowing sales in 2018 and 2019. So results are likely due to headsets still in-market (versus new sales) as an installed base.
Gear VR however is trending downward year-over-year, as expected. We project this to continue as standalone headsets take over mobile VR’s market-leading position. This will be led in future survey waves by Oculus Go and Quest (survey was fielded before Quest’s launch).
Speaking of Oculus Go, it performed well but lower than expected, with 13 percent usage among respondents. On the bright side, it reached that point from just 0% one year ago. A 13 percent market share in one year is reputable, and we expect it to exceed 30 percent of usage next year.
Playstation VR (PSVR) scored second highest in adoption at 33 percent. This makes it the most adopted among tier-1 (tethered) headsets. This isn’t surprising, given an installed base of 95 million compatible PSVR consoles, and our separate sales tracking and market share estimates.
Oculus Rift, Windows Mixed Reality and HTC VIVE (including VIVE PRO) had the third, fourth and fifth highest penetration. They scored lower than PSVR despite better specs. The takeaway: ease of setup and “all-in” pricing (PSVR’s main benefits) outsell specs like processing and FOV.
Fragmented Market
By “all-in pricing,” we mean additional hardware isn’t needed, such as gaming PCs to render high-end graphics for headsets like Rift and VIVE. Despite this PC-requirement, Windows Mixed Reality (WMR) grew from 5 percent to 16 percent, likely due to many headsets on the platform.
This trend kicked off last year and should continue into the next wave. Here’s a quote from last year’s report, which supports the point about WMR as well as the earlier assertion about Oculus Go:
“…it’s important to note the rise of new categories tracked in this wave of research, including standalone headsets and Windows Mixed Reality headsets. These headset classes have emerged in the past year and show lots of potential.
Standalone headsets especially could accelerate industry sales growth by bringing more users into VR. That’s due to a lower price point and much less friction to set up and launch VR sessions. Oculus Go in particular could be such an accelerant…”
Overall, the market continues to fragment. The players that ruled 2017 (PSVR, Rift, Vive, Gear VR) are now challenged by WMR, Oculus Go and Quest. We project strong results for the latter in the second half of 2019. More about Oculus’ strategy is explored later in this report.
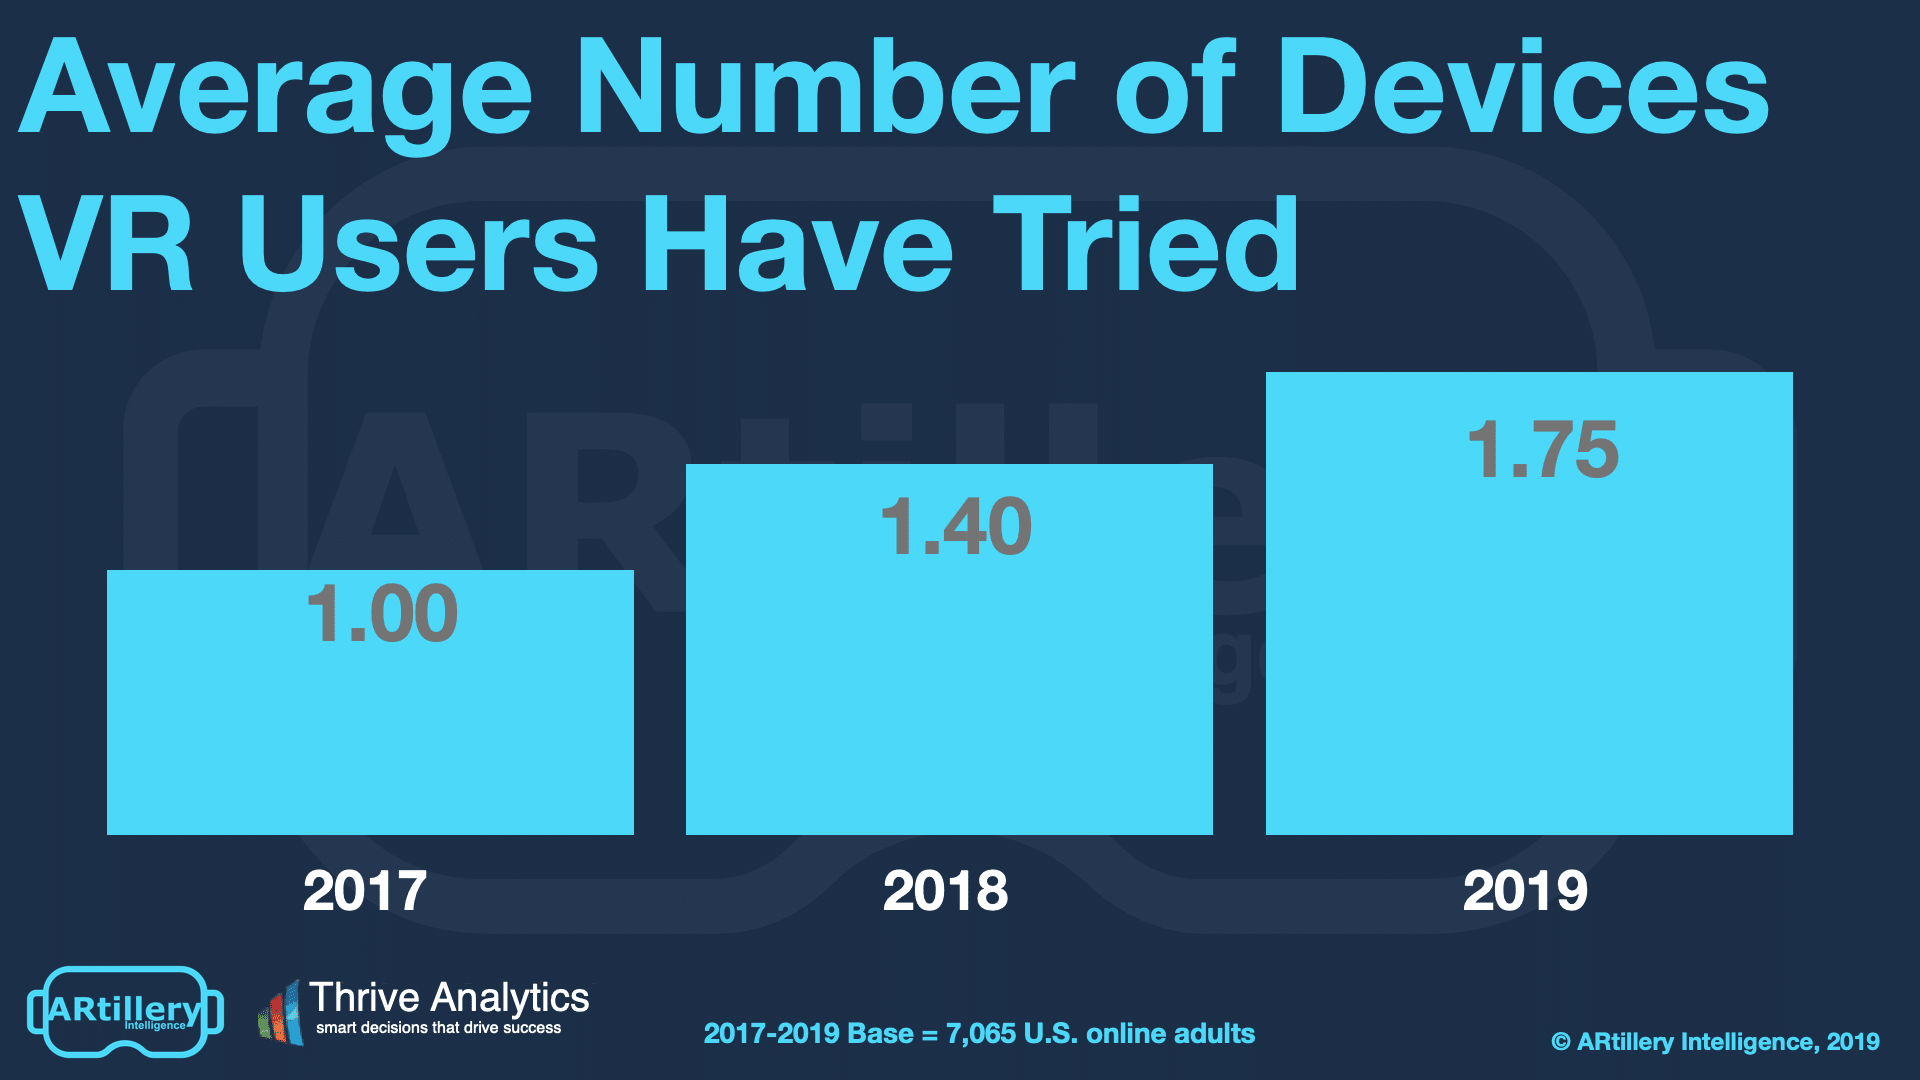
Meanwhile fragmentation is making its mark. When looking at the average number of headsets users have tried, it continues to rise. This is partially due to users’ comfort and savvy, but is also a function of more headsets in the market. This is even more pronounced in China.
Cross Section
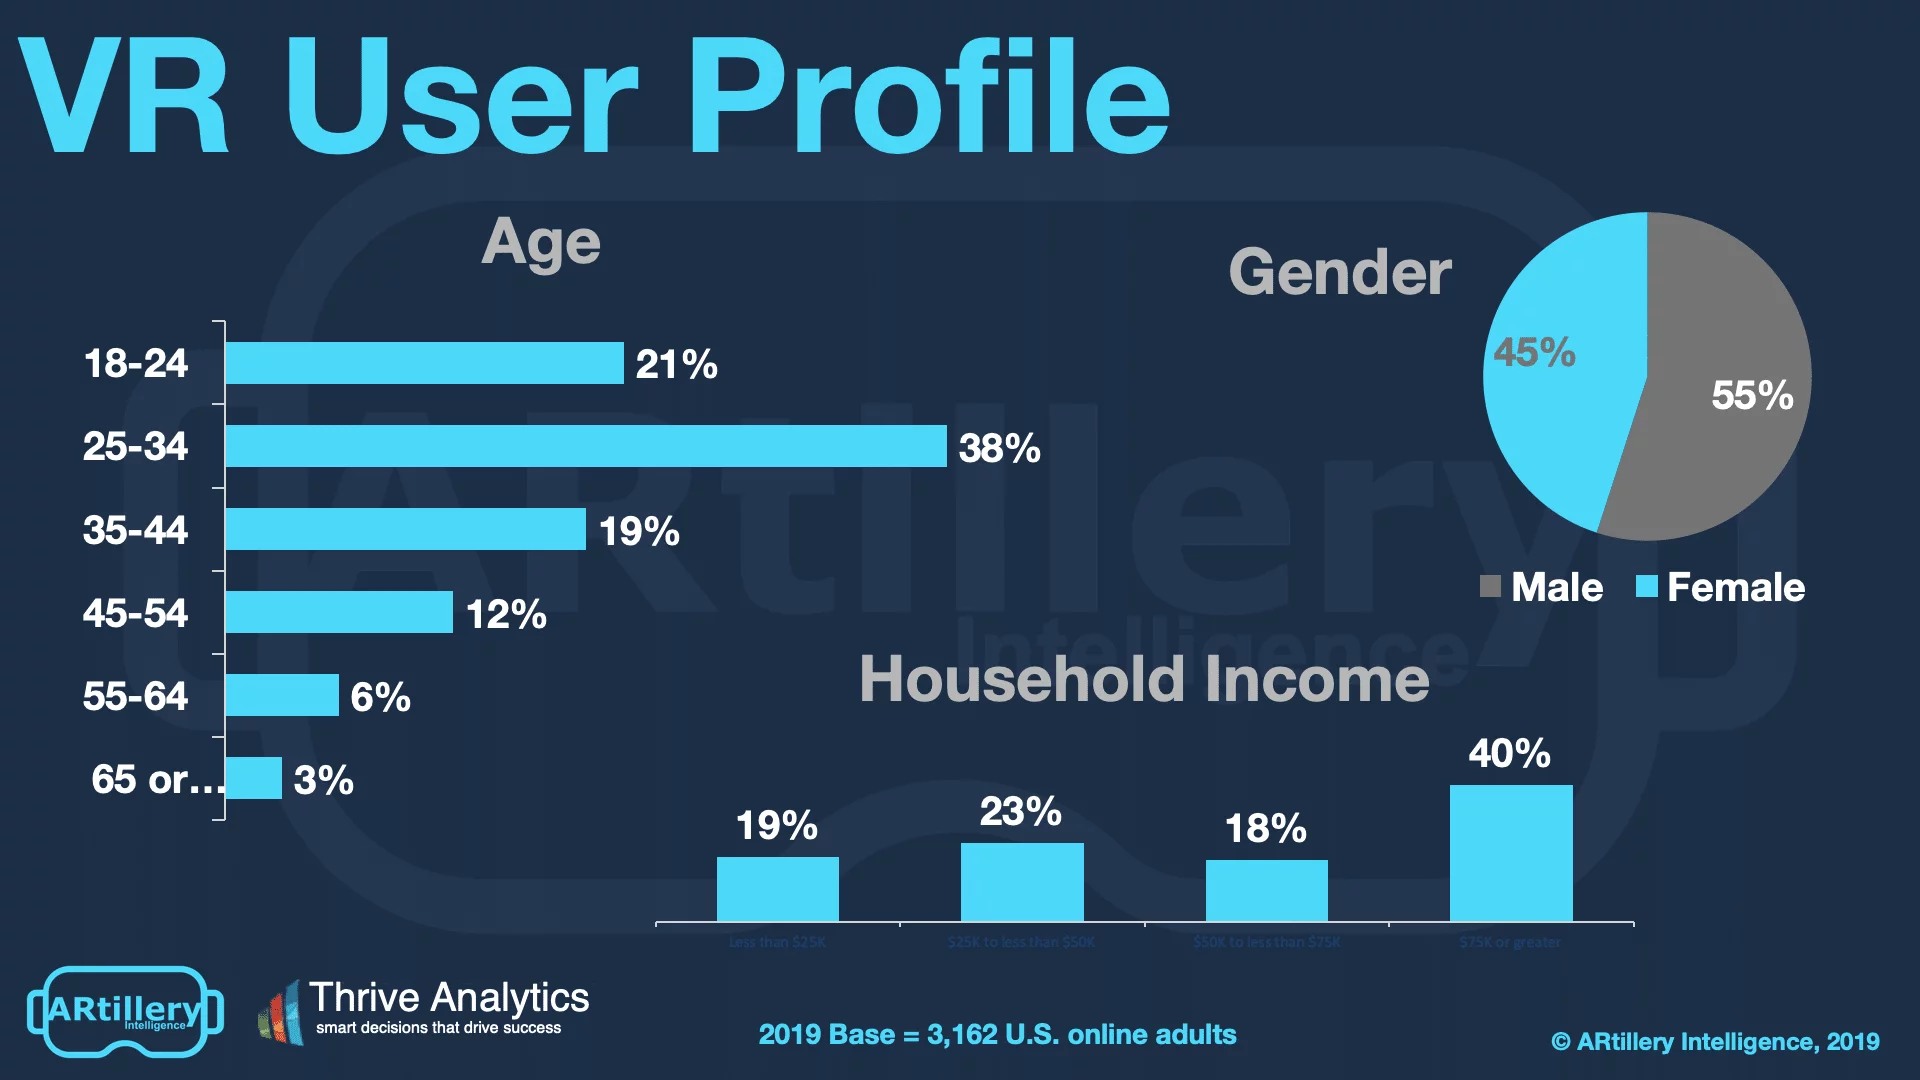
To add context to survey findings throughout this report, who’s answering the questions? It includes more than 3,100 U.S. adults. Going deeper into demographics and psychographics, the respondents break down as shown below. More detail and segmentation are available on request.
The survey sample spans a wide range of U.S. adult consumers. Gender breaks down fairly evenly, while age and income levels skew towards more attractive demographic groups. That includes active and buying-empowered age groups (25-34), and high-income homes ($75K+).
See more details about this report or continue reading here.
For deeper XR data and intelligence, join ARtillery PRO and subscribe to the free AR Insider Weekly newsletter.
Disclosure: AR Insider has no financial stake in the companies mentioned in this post, nor received payment for its production. Disclosure and ethics policy can be seen here.