

Data Point of the Week is ARtillry’s weekly dive into data from around the XR universe. Spanning usage and market-sizing data, it’s meant to draw insights for XR players, or would-be entrants. To see an indexed archive of data briefs and slide bank, subscribe to ARtillry Pro.
One lesson from the last decade in mobile app development is to be wary of vanity metrics. The most notorious is ‘app downloads’: A more telling sign of traction is monthly active users (MAU). Like many historical lessons, this will apply to AR, especially app-based mobile AR.
This has come up a few times recently including our analysis of success factors around designing for repeat usage — especially given that AR is a snack, not a meal (think: arm fatigue). And it was a key finding in our consumer AR survey results, with positive signals for AR’s recurring usage.
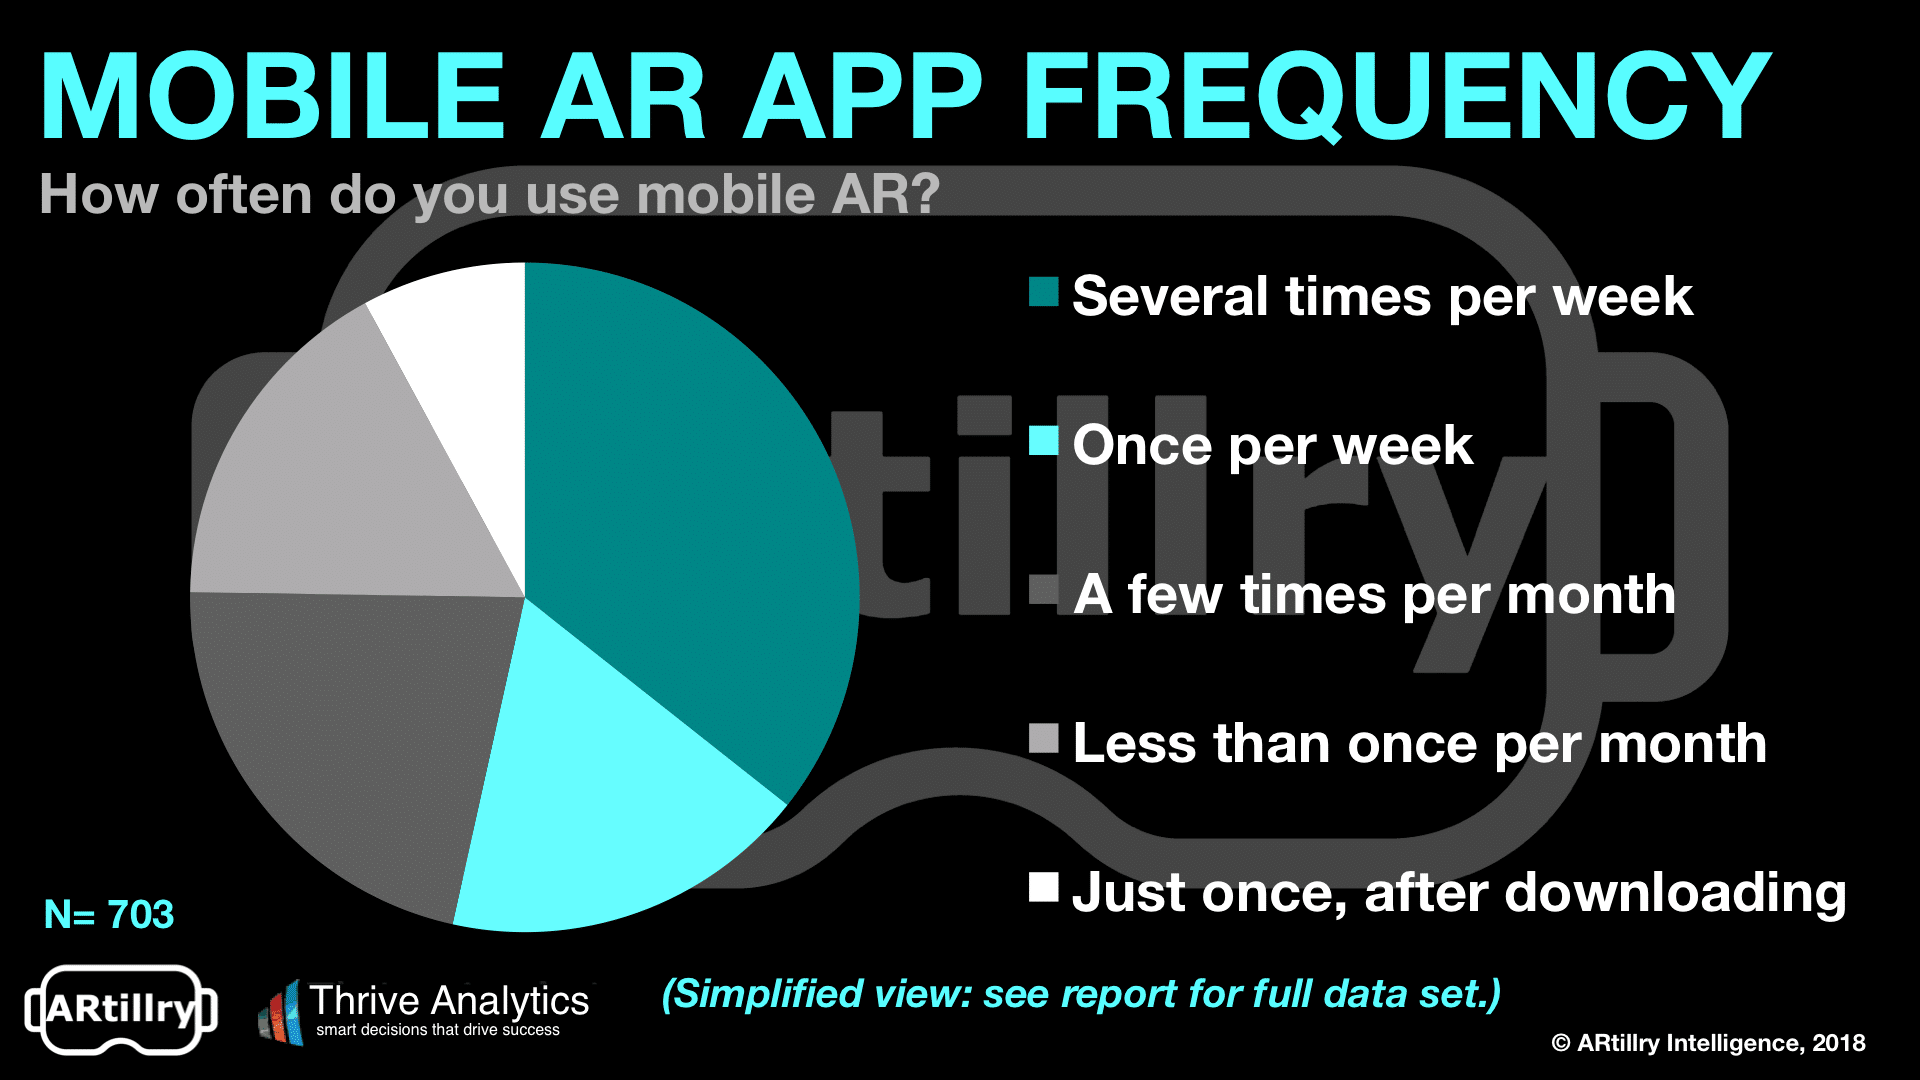
Specifically, 66 percent of mobile AR users are active at least monthly. Going one level deeper, 54 percent use mobile AR at least weekly. Only eight percent used AR just once, indicating that the active-use challenges endemic to mobile apps aren’t as great in AR, at least for now.
But going even deeper, what types of apps are driving repeat usage? We’ve separately looked at the types of apps that get the most traction, with games and social not surprisingly leading. But what happens when you array these categories against the above usage frequencies?
We went back to the raw survey data set for answers. For each respondent that reported the type of apps they use, how did they answer the above frequency question? The results are below, with each app type broken down by reported frequency of usage, and some notable findings.
For example, though games lead usage overall, they have the highest share of users within any category that don’t return after one use. This shouldn’t be a damning point for the health of mobile AR games as their absolute usage and frequency remain highest of the pack.
Conversely, product visualization apps have the highest share of their users returning with the greatest frequency (several times per week). That’s followed by education, and social apps. These each trail games in overall usage but exceed in the share of their respective users that return.
Product visualization makes sense as a high-frequency activity, as does education. But it’s surprising that social trailed both of them in share of users returning semi-daily. Social AR’s high frequency is expected because it’s communications (AR lenses) — a naturally recurring event.
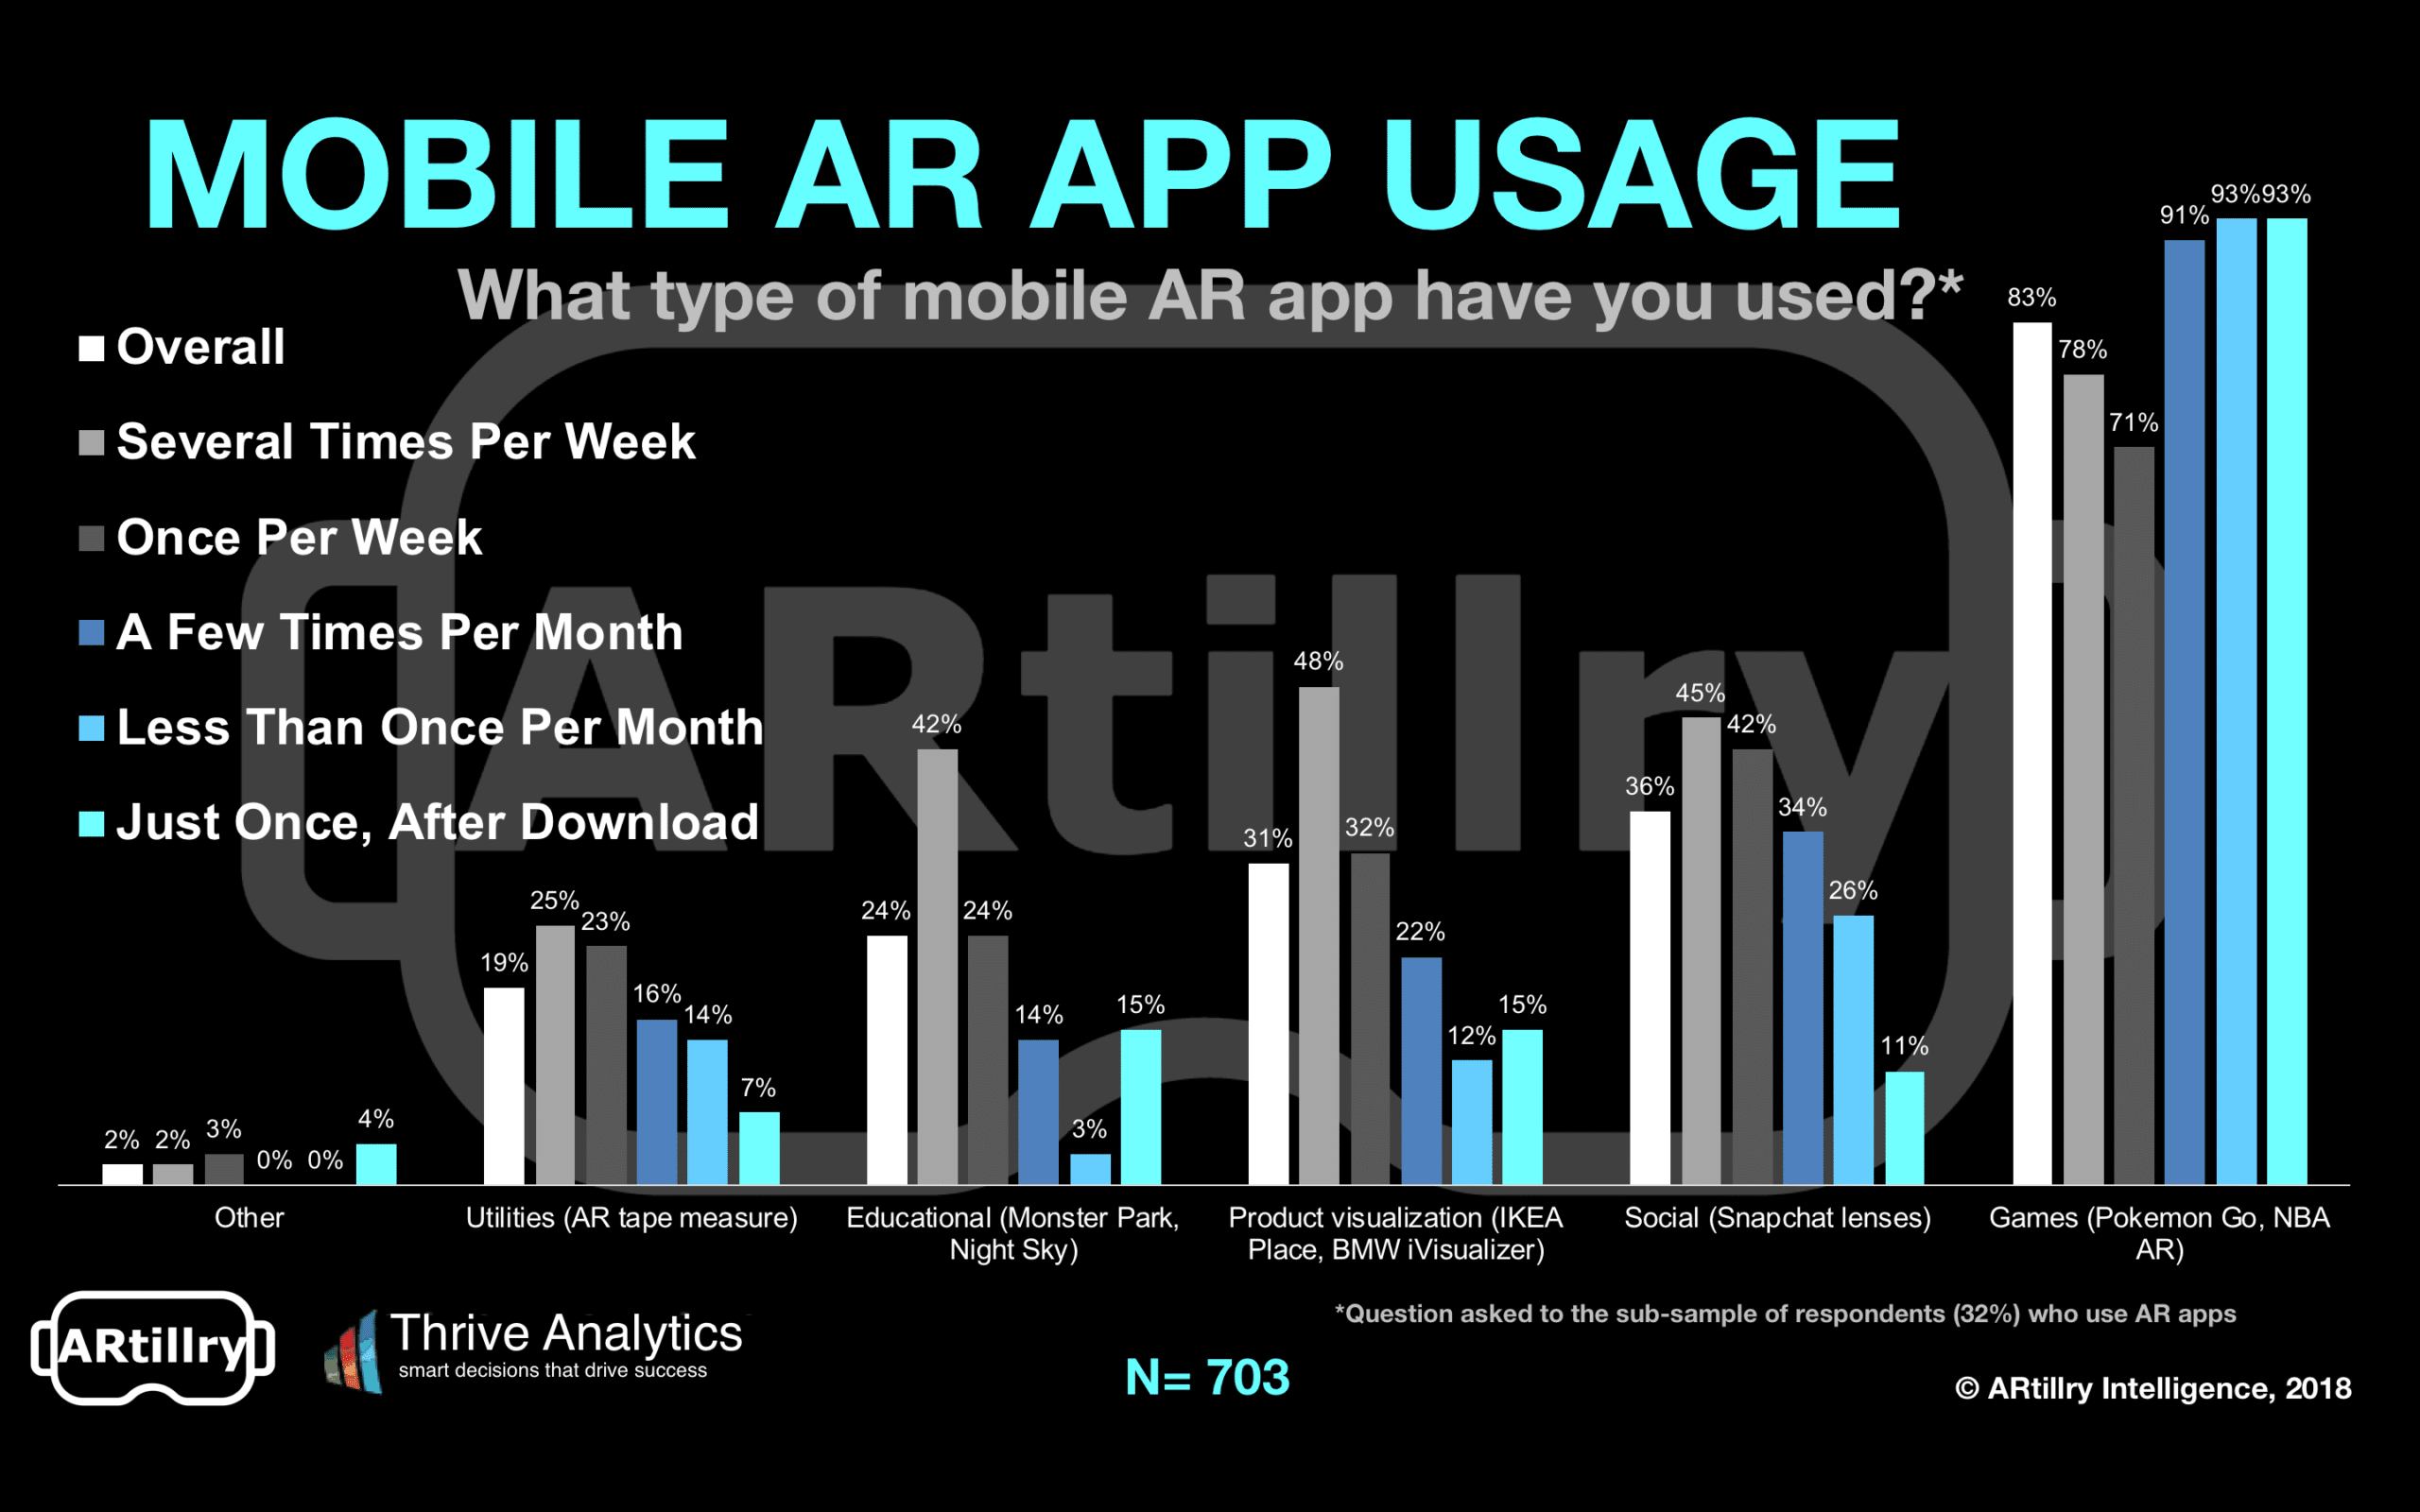
One lesson is that certain categories of apps are inherently advantaged when it comes to tendency for recurring use. But that’s only half the battle: Execution is critical within all categories to create compelling and sticky AR experiences that blend novelty, game mechanics and design.
And though the games category had a high share of its users that don’t return, it still dominates AR in sheer volume, and likely will for a while (just ask Happy Giant). Stay tuned for more data breakdowns as early phases of mobile AR continue to pose strategic question marks.
For deeper XR data and intelligence, join ARtillry PRO and subscribe to the free ARtillry Weekly newsletter.
Disclosure: ARtillry has no financial stake in the companies mentioned in this post, nor received payment for its production. Disclosure and ethics policy can be seen here.