
This post is adapted from ARtillery Intelligence’s latest report, VR Usage & Consumer Attitudes, Wave III. It includes some of its data and takeaways. More can be previewed here and subscribe for the full report.
How do consumers feel about VR? Who’s using it? What devices and apps do they use? And what do they want to see next? Perhaps more importantly, what are non-users’ reasons for disinterest? And how can VR players optimize product strategies accordingly?
These are key questions that our research arm ARtillery Intelligence set out to answer. Working with Thrive Analytics, they presented questions to more than 3,100 U.S. adults in Thrive’s established survey engine. And they’ve analyzed the results in a narrative report.
This follows similar reports completed over the past two years. Wave III of the research now emboldens the perspective and brings new insights and trend data to light. All three waves represent a collective base of 7,065 U.S. adults for a robust longitudinal analysis.
This week, we’ll dive into how many consumers are using VR and more importantly, how often.
VR Users: the “How Many?”
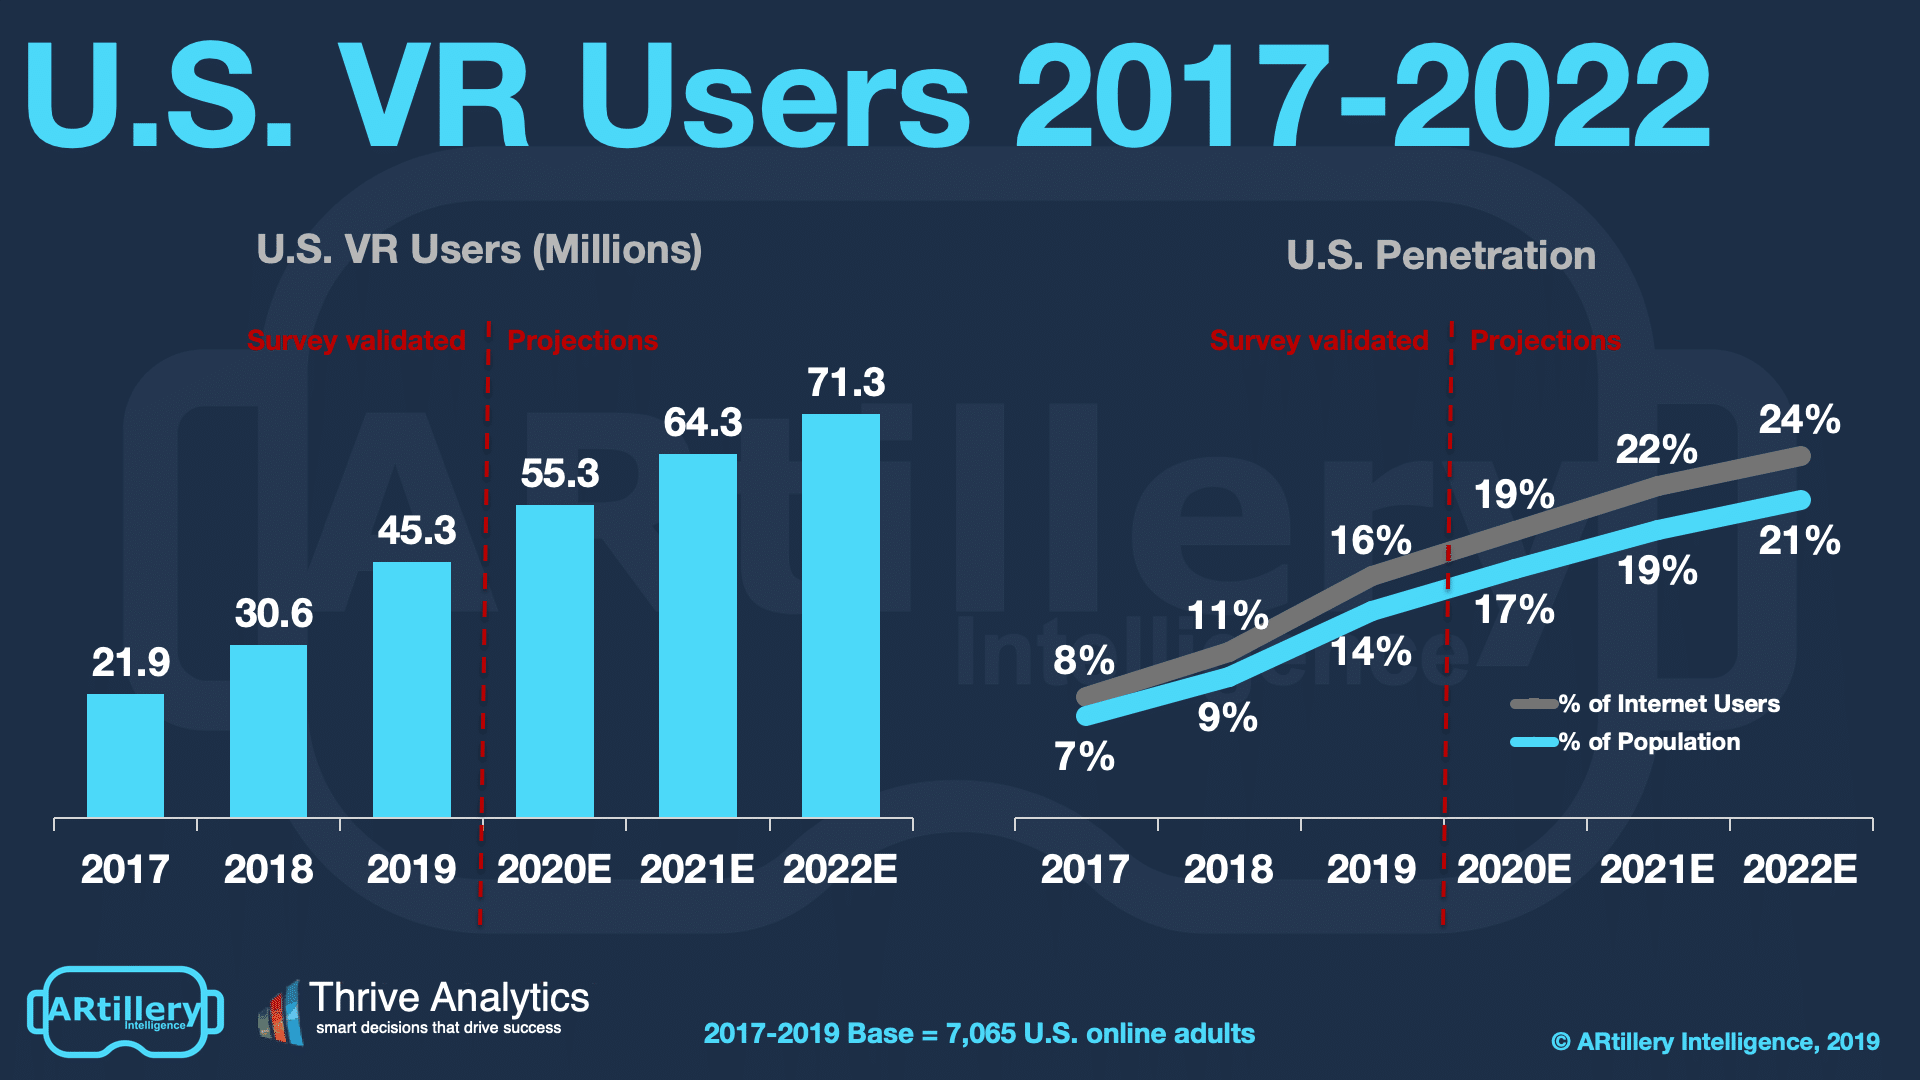
Starting our analysis at the very top, what’s the overall penetration and adoption of VR among consumers? Survey results indicate that it currently stands at 16 percent. This aligns with headset penetration figures reported in ARtillery’s Global XR Forecast, and is up from 11 percent in 2018.
Applying that percentage to the U.S. adult population yields a total base of 45.3 million users, up from 30.6 million in 2018. This is different than the total installed base of VR headsets in market. The latter is a smaller figure, examined later in this report, due to multiple users per headset.
Speaking of signals, we project VR to reach 71 million users (different than device volume ) by 2022, which will be 24 percent of internet users. Projections stem from three years of survey data, trendline analysis and other factors such as historical growth comparisons and sales momentum.
Frequency: the “How Often?”
Perhaps more important than number of users, a key variable in tracking success in any digital media is how often it’s being used. Because VR adoption barriers can be high (tracking system set up, technological invasiveness, etc.), the name of the game is ease of use and replayability.
This challenge is starting to recede with the advent of standalone headsets like Oculus Go and Quest (note: this survey was fielded prior to Quest’s launch). So we believe frequency metrics will improve over time. Meanwhile, they show some strengths and some areas to improve.
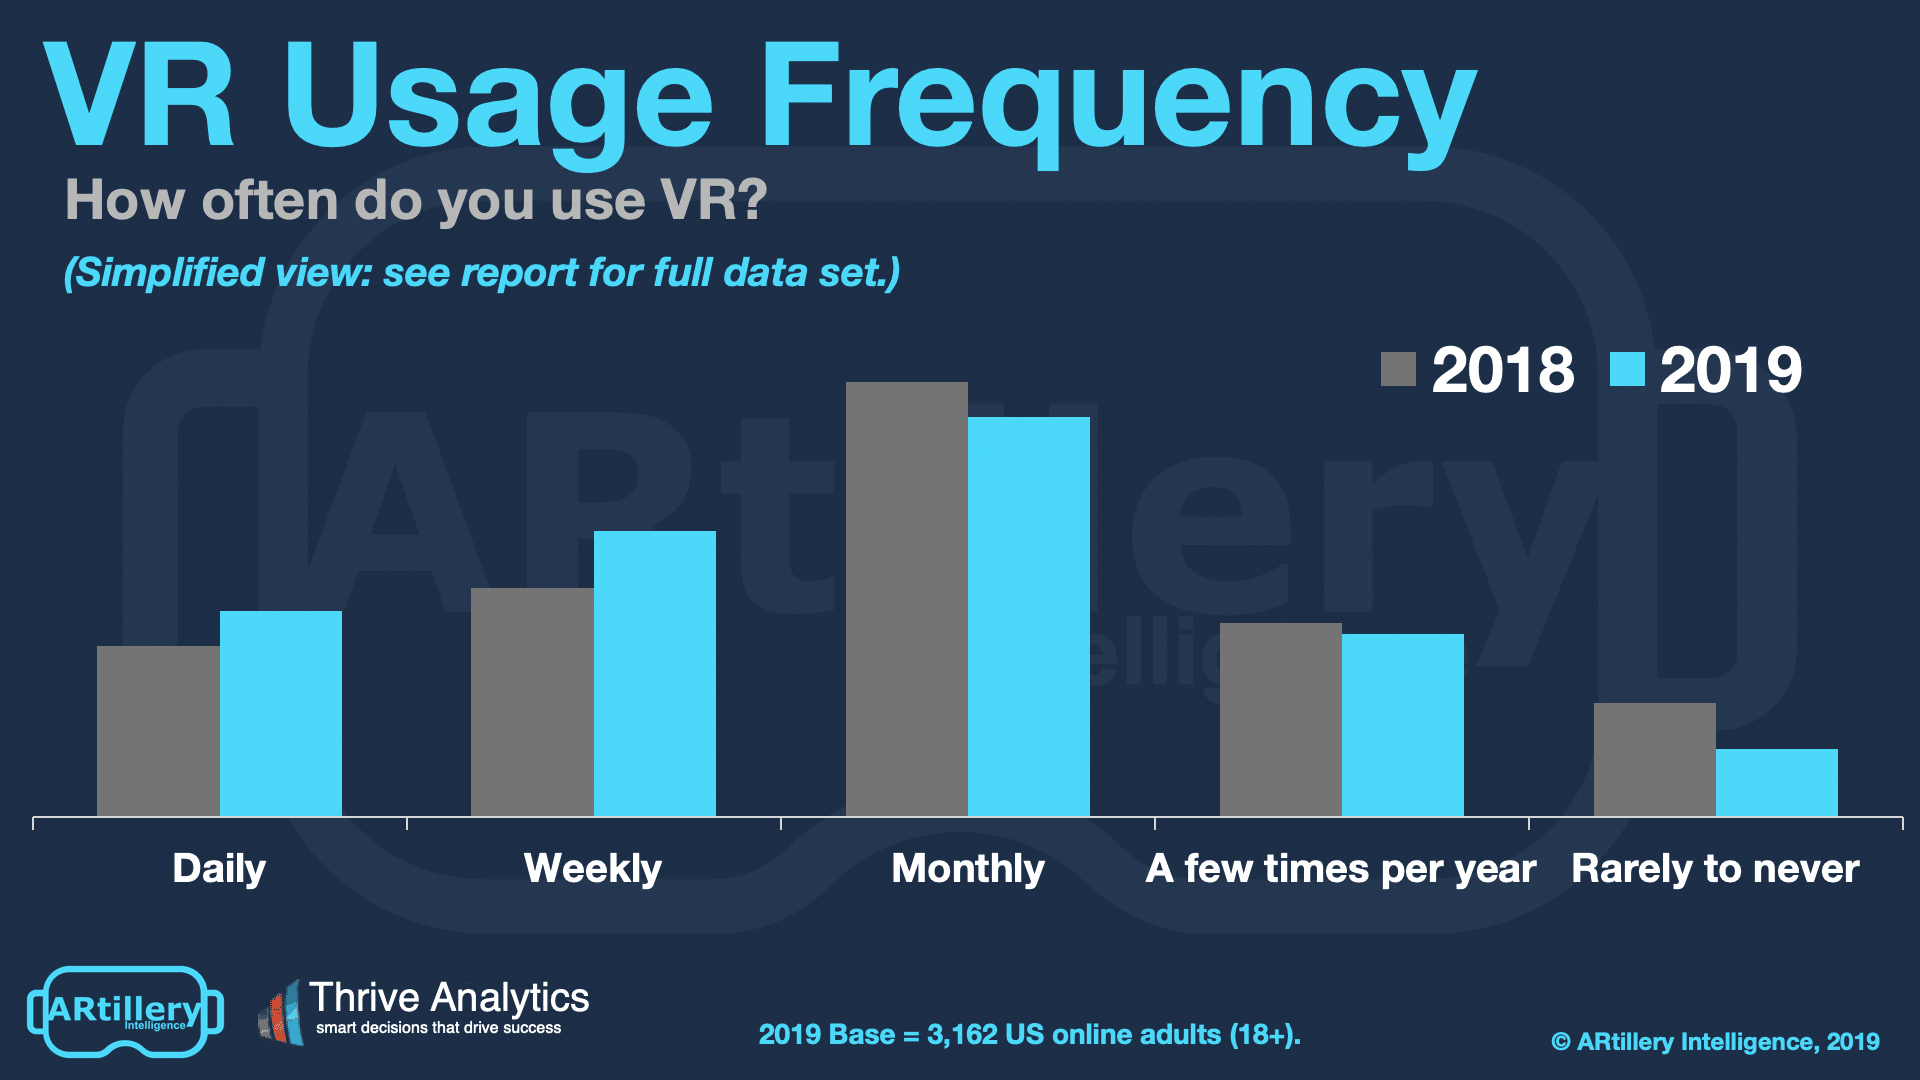
Specifically, most VR users engage monthly (35%) followed by weekly (25%) and daily (18%). This means 78 percent of users activate monthly or more, while 22 percent do so monthly or less. This is a strong signal for VR engagement compared to other consumer tech like mobile apps.
As for year-over-year trending, daily and weekly usage are up three-percentage points and five percentage points respectively. Monthly usage is down three percentage points. This shows that users are engaging more often, possibly due to more standalone headsets in the market this year.
Standalone headsets such as Oculus Go reduce VR friction. Among other things, this should increase frequency, already seen in this survey wave. Any effects so far are likely due to Oculus Go’s limited tenure, and will improve with more time and with Oculus Quest’s penetration.
Cross Section
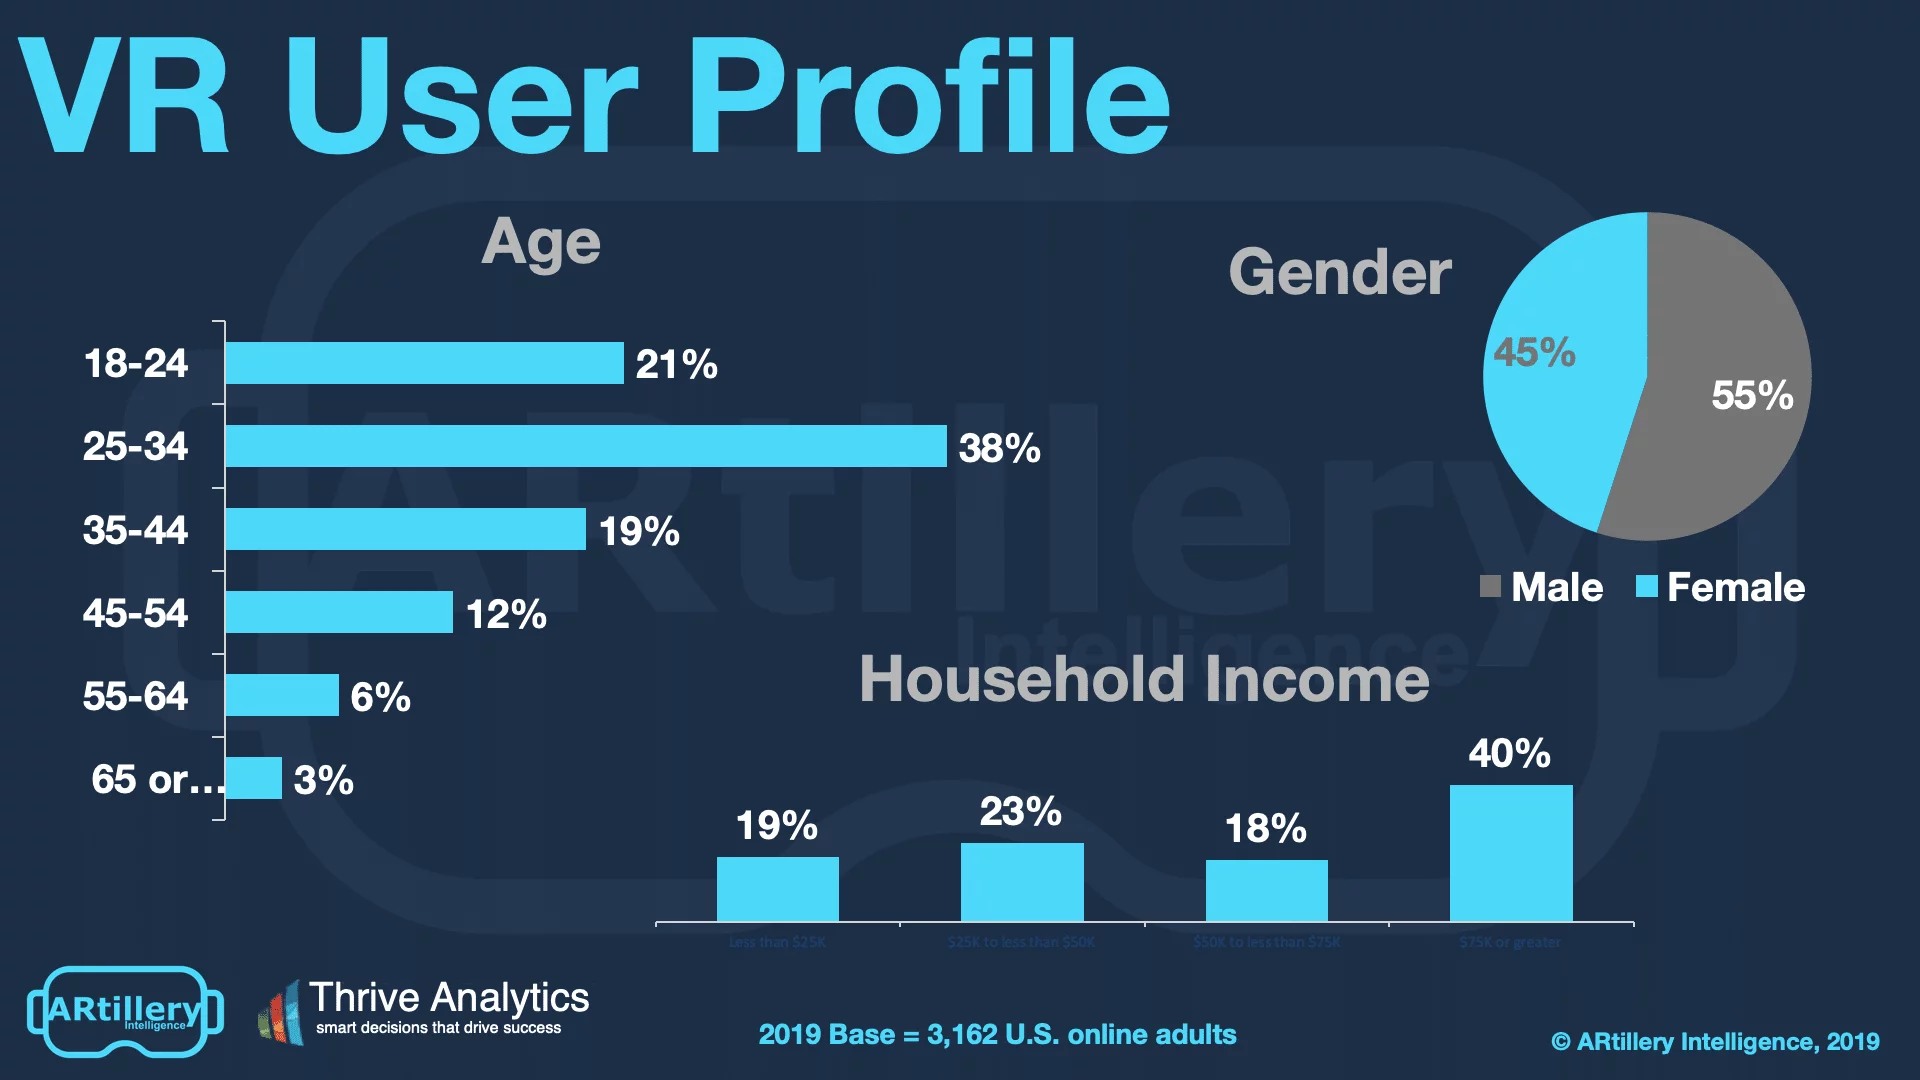
To add context to survey findings throughout this report, who’s answering the questions? It includes more than 3,100 U.S. adults. Going deeper into demographics and psychographics, the respondents break down as shown below. More detail and segmentation are available on request.
The survey sample spans a wide range of U.S. adult consumers. Gender breaks down fairly evenly, while age and income levels skew towards more attractive demographic groups. That includes active and buying-empowered age groups (25-34), and high-income homes ($75K+).
See more details about this report or continue reading here.
For deeper XR data and intelligence, join ARtillery PRO and subscribe to the free AR Insider Weekly newsletter.
Disclosure: AR Insider has no financial stake in the companies mentioned in this post, nor received payment for its production. Disclosure and ethics policy can be seen here.