

Data Point of the Week is AR Insider’s dive into the latest spatial computing figures. It includes data points, along with narrative insights and takeaways. For an indexed collection of data and reports, subscribe to ARtillery Pro.
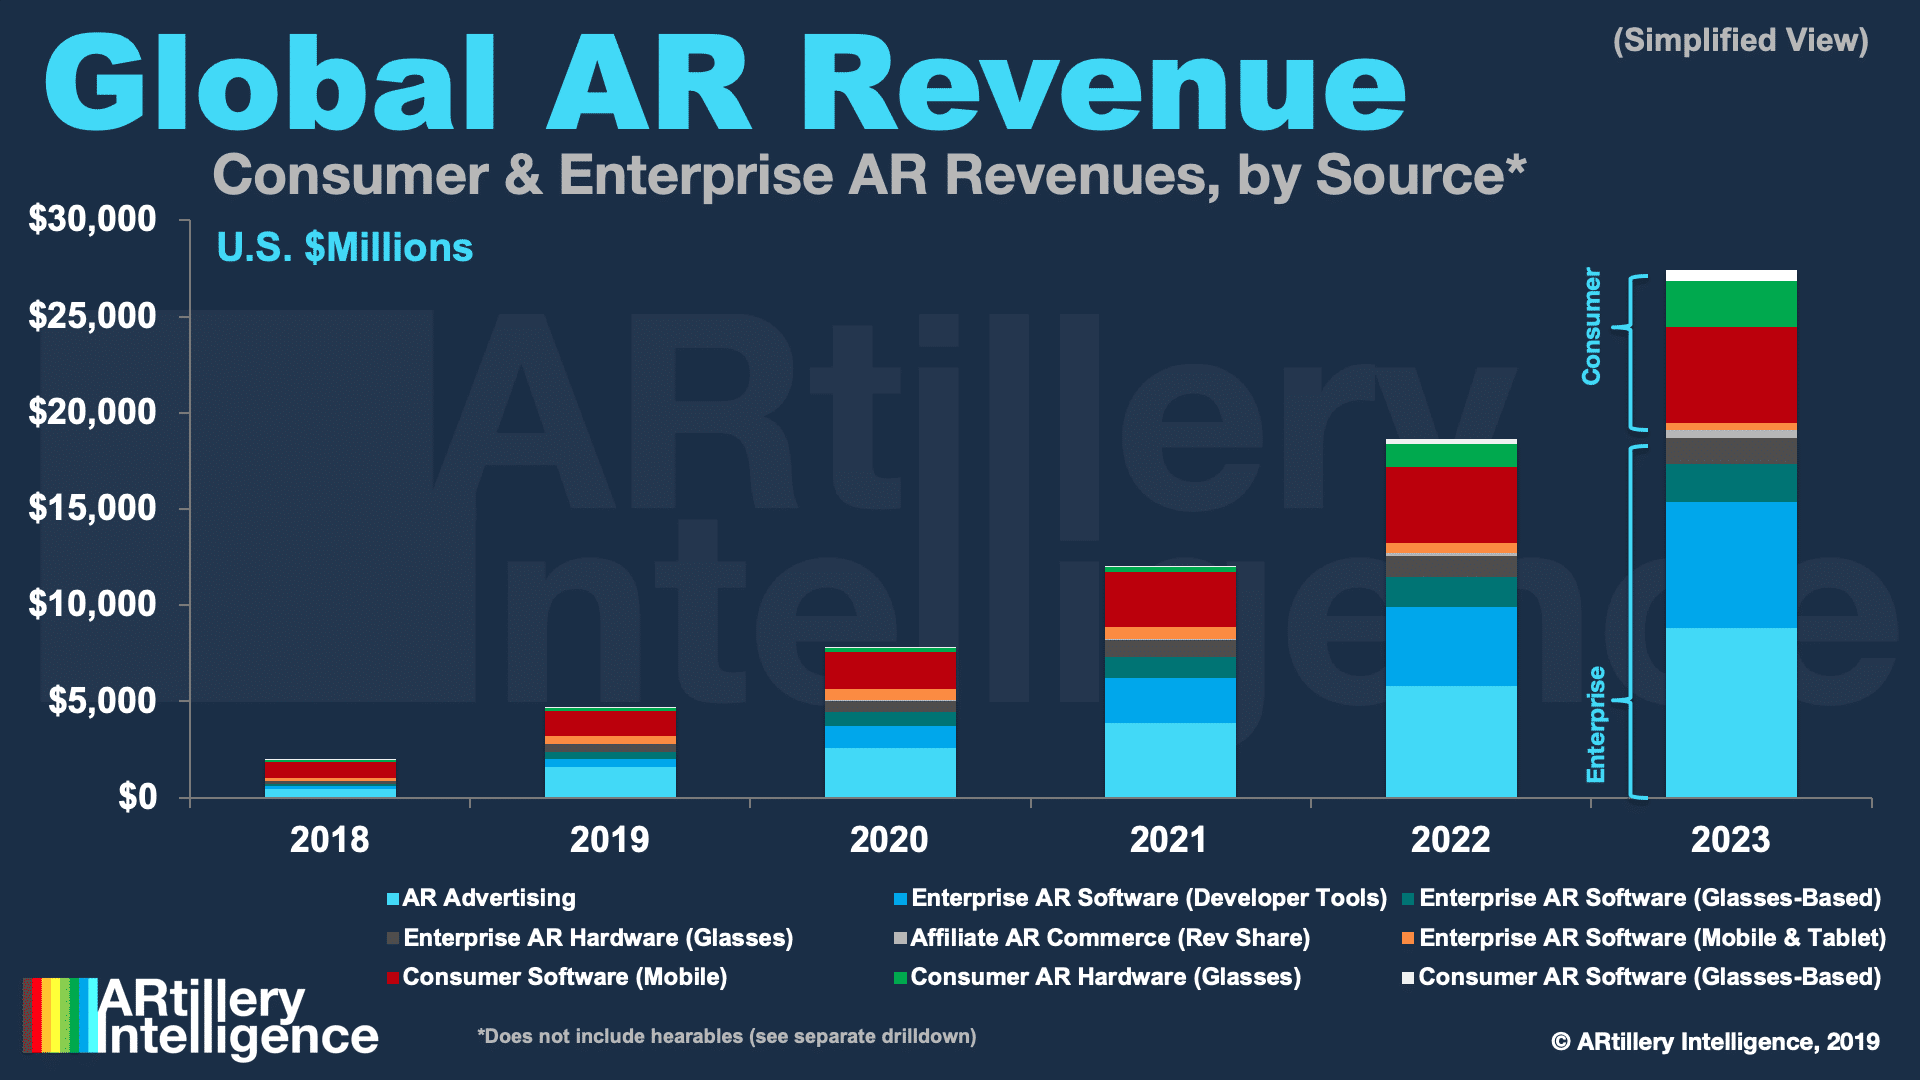
In-app purchases (IAP) are one of the three prevalent consumer AR business models examined in a recent report by our research arm ARtillery Intelligence. The others are advertising and “AR as a service” developer tools for consumer-facing brands to build experiences for their customers.
In revenue rankings, In-app purchases had an early lead thanks to Pokemon Go’s 2016 launch surge. Though it’s dipped since then and the tech press has moved on to other shiny objects, the game is having quite a resurgence as Niantic infuses lots of new elements to maintain novelty.
But that didn’t stop IAP from slipping to second place in ARtillery’s market sizing. Advertising has taken the lead with brand advertisers’ realization that AR lets them demonstrate products in immersive ways and throughout the purchase funnel. Seeing results, they’re doubling down.
That drove $1.58 billion in estimated AR ad spending last year, on pace $2.6 billion this year. Meanwhile, IAP saw estimated 2019 revenues of $1.3 billion, on pace for $1.9 billion this year. That’s driven mostly by the current revenue momentum and PGO’s ongoing performance.*
Supporting Evidence
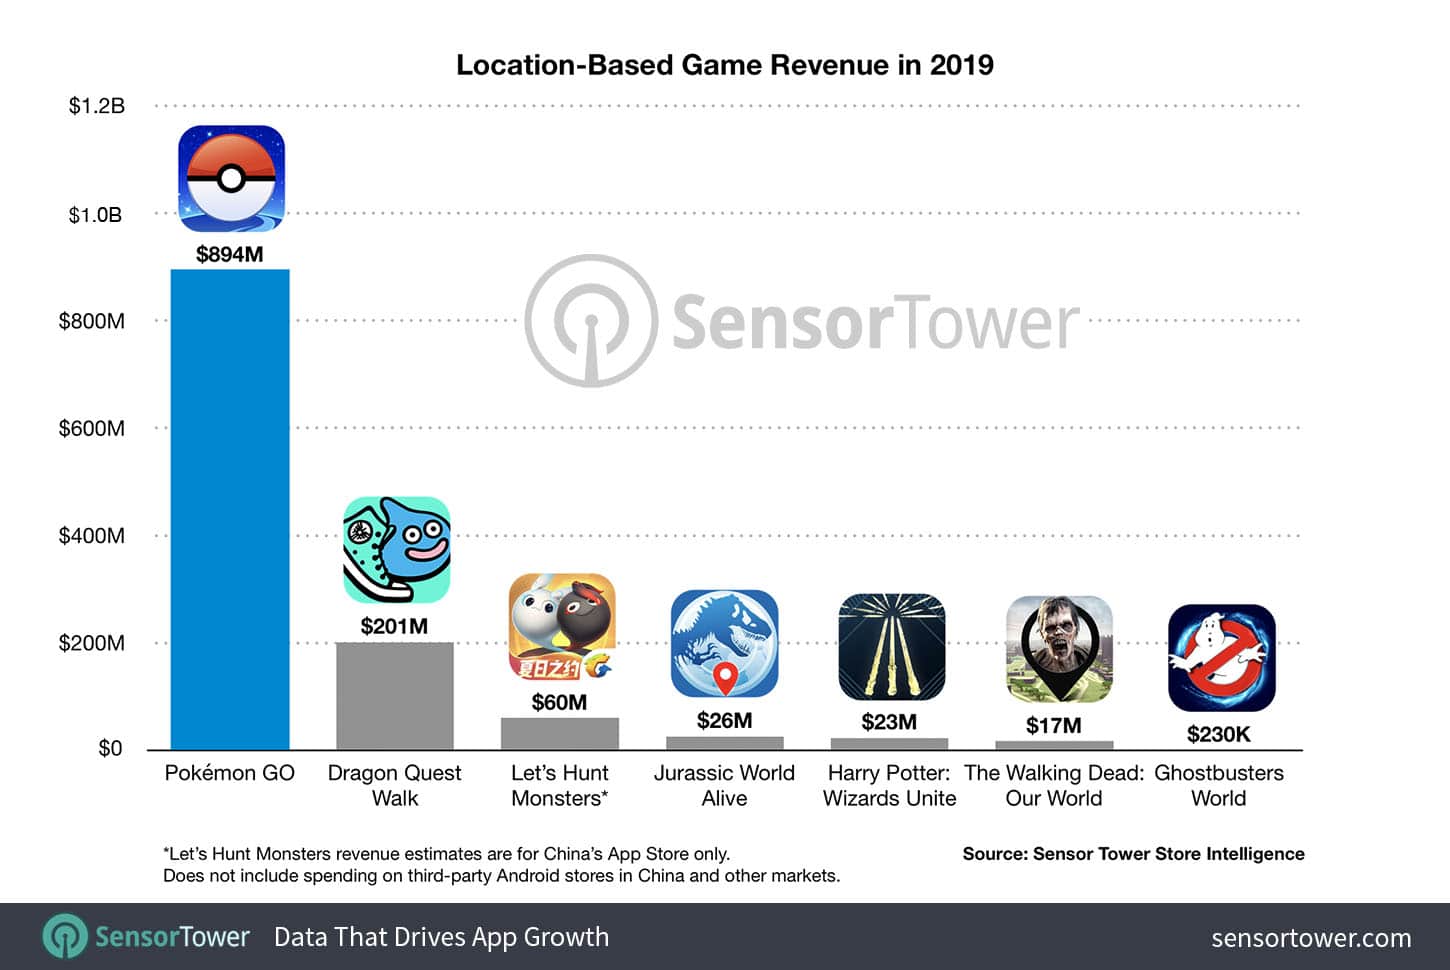
Supporting this are data from Sensor Tower** which estimate $1.45 billion in 2019 IAP revenue in location-based AR gaming. That’s close to the $1.3 billion mentioned above and validates both figures, as is often the case when disparate entities and methodologies arrive at the same place.
After Pokemon Go’s revenue lead with $894 million in estimated 2019 revenues, rankings include Dragon Quest walk with $201 million. That’s followed by Let’s Hunt Monsters ($60 million), Jurassic World Alive ($26 million), Harry Potter Wizards Unite ($23 million) and others listed below.
There are a few takeaways. First, Pokemon Go’s commanding lead makes it ripe for transferrable lessons and best practices. ARtillery Intelligence did this in its latest monthly report, including factors like the aforementioned game updates, underlying IP and Niantic’s product philosophies.
Beyond PGO’s unique mix of factors, it’s notable that copying game mechanics with a new IP skin won’t achieve the same success. Even with Niantic’s prowess and location-based chops (Real World Platform), Harry Potter Wizards unite falls well short of PGO, though strong in its own right.
Behavioral Economics
Beyond play dynamics, this validates Pokémon Go’s in-app purchases (IAP) revenue model. It’s inherited from the broader mobile gaming world, where it approaches $70 billion in annual revenue on the behavioral economics of microtransactions (all that money you spend on Candy Crush).
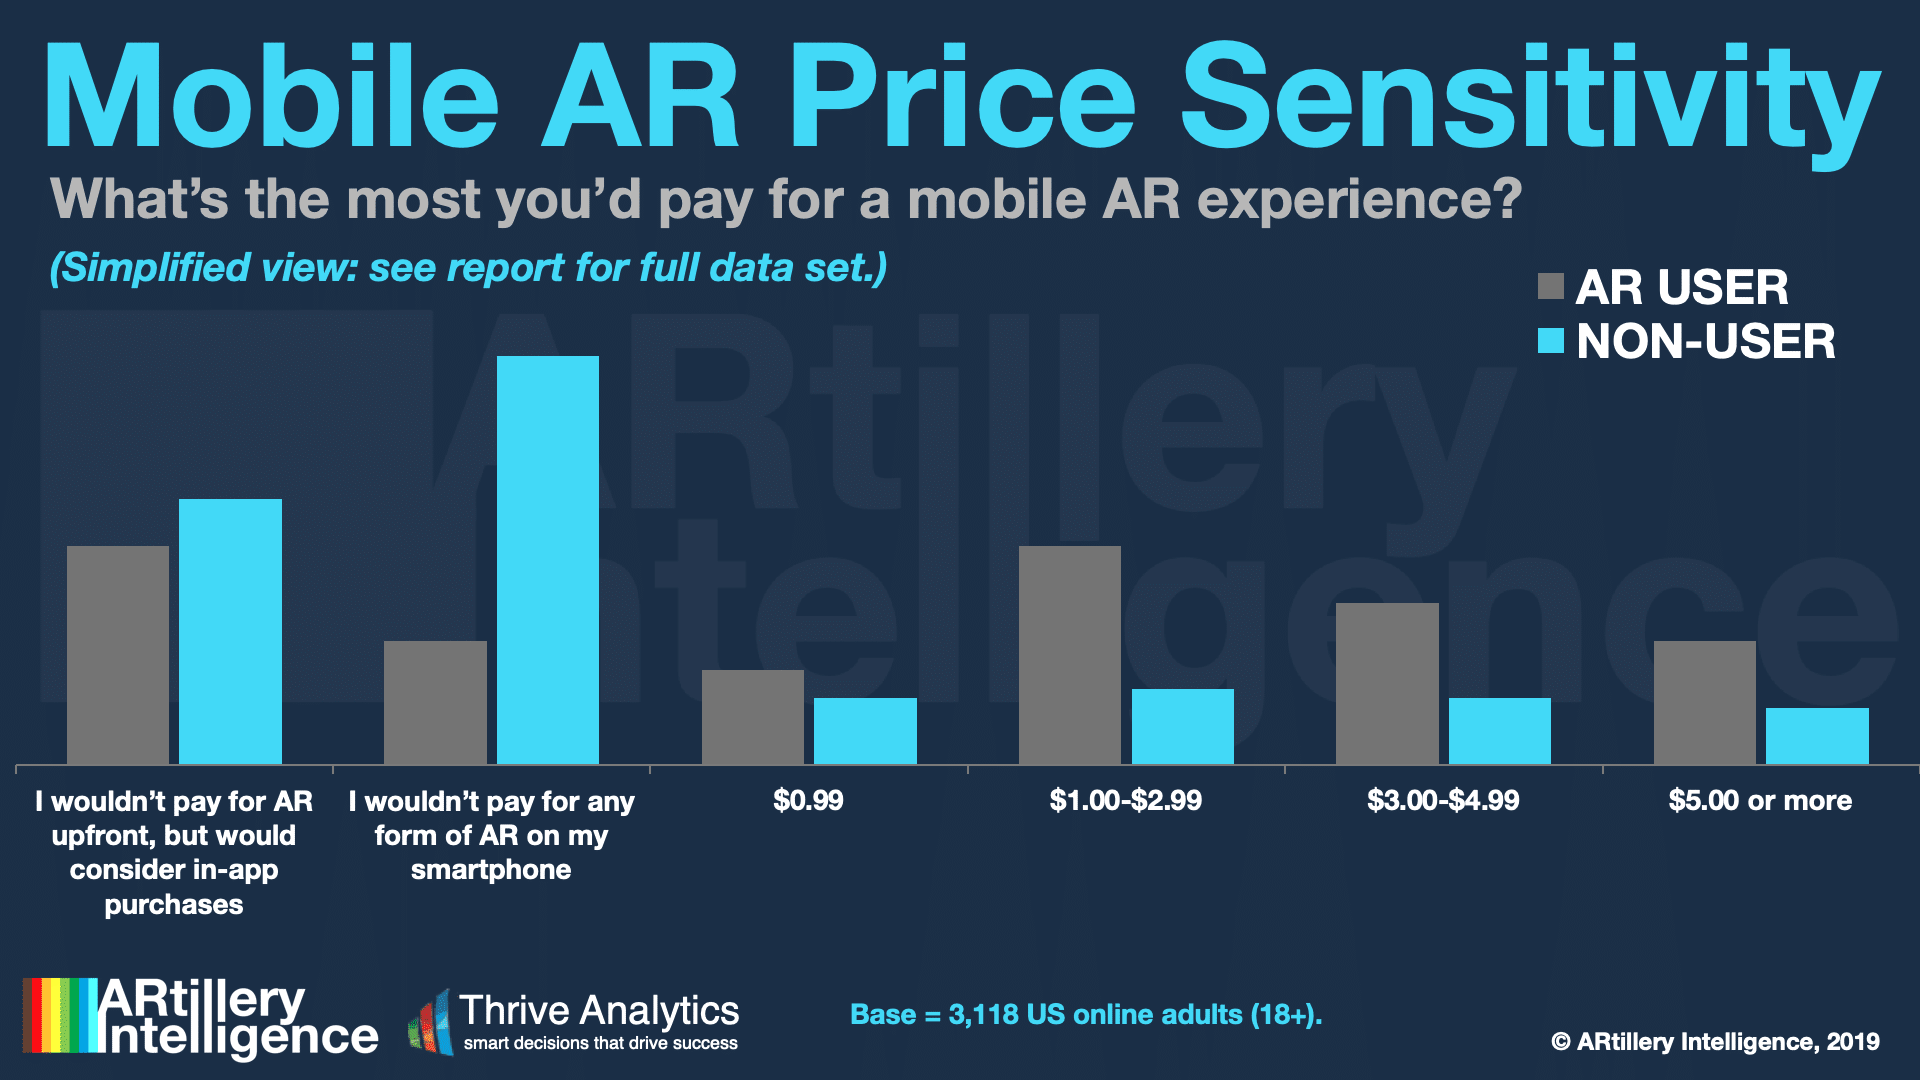
Not only is IAP validated in mobile gaming but it’s fitting to AR’s early stage when users hesitate to pay upfront for premium apps. Beyond revenues, IAP is supported by consumer survey data from ARtillery Intelligence, and the aforementioned report on top consumer AR business models.
But the question remains how the above pace will sustain. Growth rates diminish as revenue escalates and period-over-period growth is calculated from a larger denominator. This compels revenue diversification or adjacent products that boost variable revenue against fixed cost.
This is precisely what Niantic recently did by expanding the capacity of its secondary revenue stream for in-game brand sponsorship. Previously available to multi-location brands like McDonald’s and Starbucks, it will now tap into the long-tail SMB marketplace.
This will be worth watching, as early industry leaders like Niantic do the industry a favor through the large-scale deployment. That can uncover key market dynamics and demand signals which is valuable intelligence in early stages of any consumer technology. We’ll be tracking it closely.
*There’s debate over whether or not these games, and thus their associated revenue, should be considered “AR.” We address those questions separately here.
**Sensor Tower’s Store Intelligence figures are extrapolated third party data based on consumer behavior in its network, rather than first-party data from Niantic. The data are still reliable given Sensor Tower’s network reach.
For deeper XR data and intelligence, join ARtillery PRO and subscribe to the free AR Insider Weekly newsletter.
Disclosure: AR Insider has no financial stake in the companies mentioned in this post, nor received payment for its production. Disclosure and ethics policy can be seen here.
Header Image Credit: Sensor Tower