

Data Point of the Week is ARtillry’s weekly dive into data from around the XR universe. Spanning usage and market-sizing data, it’s meant to draw insights for XR players, or would-be entrants. To see an indexed archive of data briefs and slide bank, subscribe to ARtillry Pro.
What usage patterns are evident in Pokemon Go? This is important given that it’s arguably AR’s biggest success story so far, and can therefore have replicable tactics and best practices. Given AR’s nascence and lack of benchmarks, data like this can be valuable in vetting product models.
Business of Apps recently aggregated Pokemon Go usage data, which we’ve combined with a few other sources and narrative insights peppered below. Starting with basic usage, there are about 65 million monthly active users (MAU), and the app has made about $1.4 billion in revenue.
Quick stats
Monthly Active Users — 65 Million
Total revenue to date – $1.4 billion
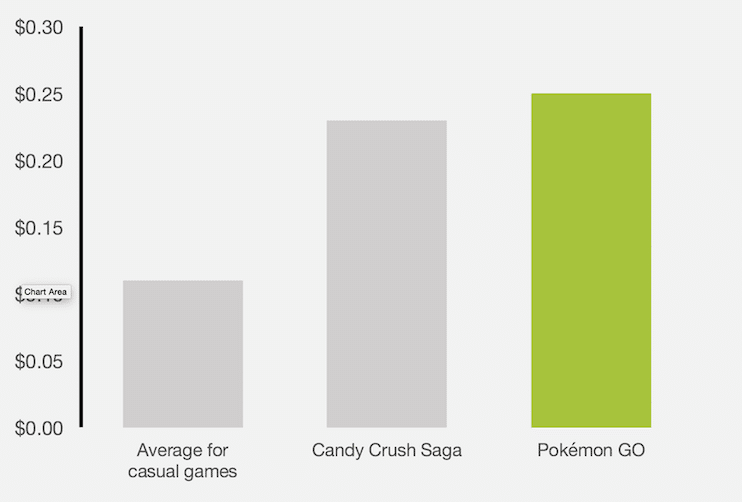
Average revenue per DAU – $0.25
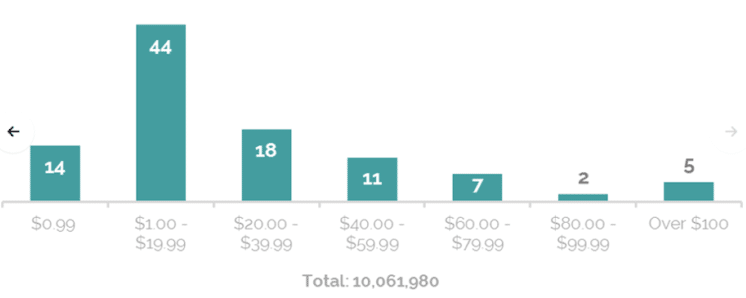
Percentage of iOS users that do in-app purchases – 80%
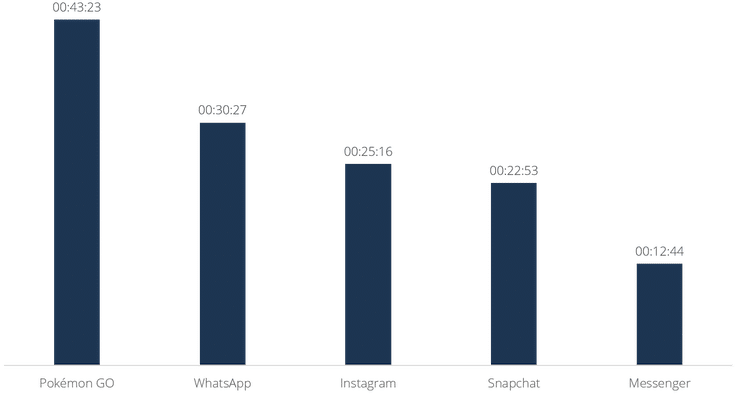
Time Android users spend with the game daily – 43 minutes
Three day retention – more than 60%
Gender female vs. men split percentage – 40/60
The App Store rankings – 3 stars
Google Play rankings – 3,2 stars
Active Usage: The First Step to Monetization
Drilling down further, a key metric in app success is active usage, as we’ve recently analyzed. It’s important for ongoing engagement levels which are the basis for monetization models that continue to develop. And on that measure Pokemon Go shows strong active use and “stickiness.”
This has a lot to do with its game mechanics that blend novelty with ongoing challenge and leveling up, while striking a balance of attainable goals. There are social and multi-player aspects to the game that likewise drive that sticky and active ongoing use. And it outshines benchmarks.
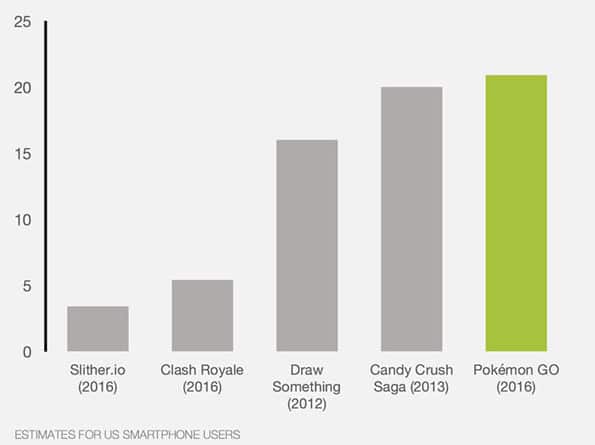
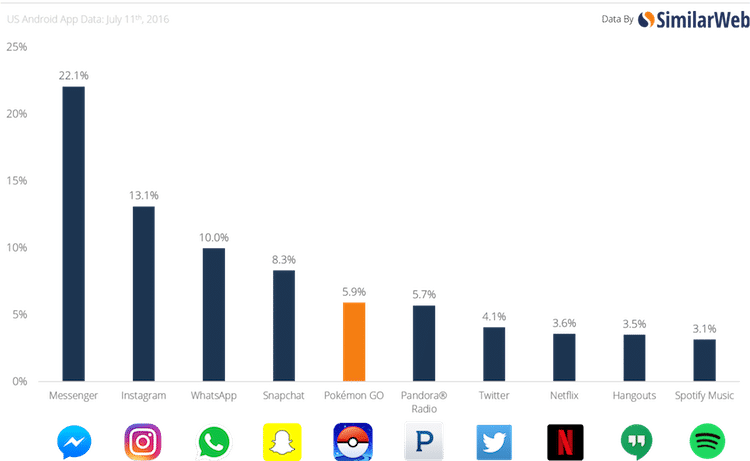
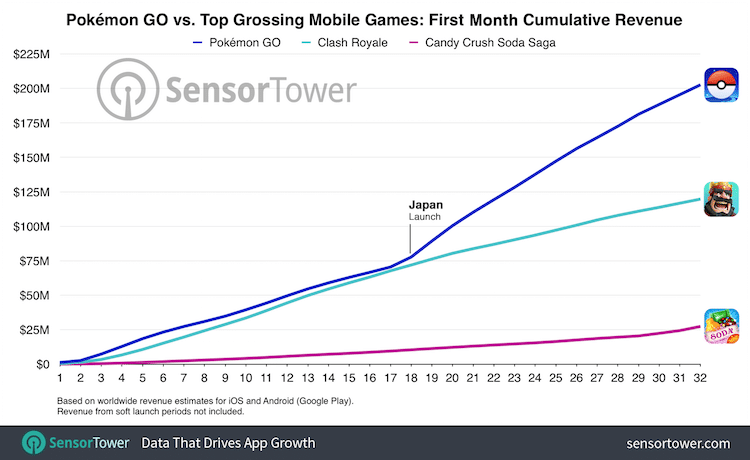
This includes active daily use, as well as session lengths. For the former, Pokemon Go outperforms popular games such as Candy Crush. It’s also notable that the apps that outperform Pokemon Go are social, indicating once again that social=stickiness and network effect.
Monetization: What Really Matters
The above comments about active usage leading to monetization can be further validated by the fact that Pokemon Go shows strong monetization metrics. That includes key performance indicators like average revenue per user (ARPU), which it has driven mostly through in-app purchases (IAP).
As we examined recently IAP will be an important source of revenue in consumer mobile AR. This hypothesis comes from historical evidence in the smartphone era, and AR’s unique engagement levels — when done right — that could drive purchases, as opposed to ad monetization.
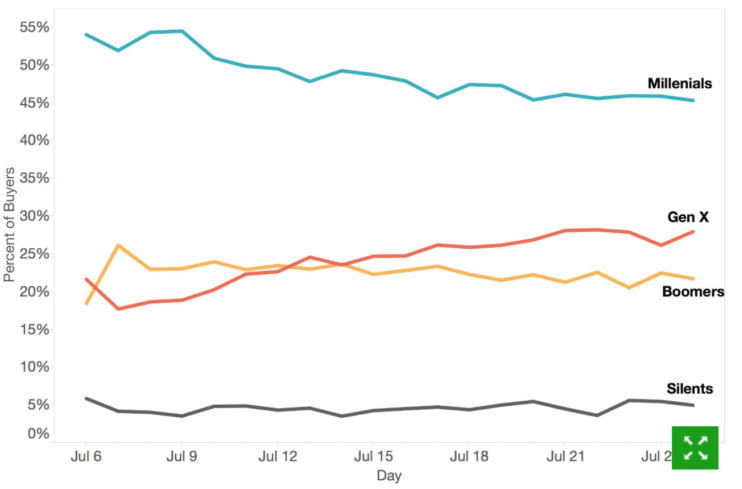
Specifically, Pokemon Go shows strong metrics for percentage of users that purchase in-game items using IAP. For example, about half of millennials users purchase within the app. Other metrics include ARPU and overall monetization compared with other popular games and apps.
A few takeaways include the fact that Pokemon Go has several factors that drive its success: engaging play, strong IP (the Pokemon Brand) and some social/multiplayer mechanics. The latter could be dialed up a bit and will be a key component of mobile AR models and killer apps.
As for IP, more lessons about AR best practices will flow from Niantic’s follow up to Pokemon Go, Harry Potter, Wizards Unite. Meanwhile, it’s all about absorbing as much usage data as possible to draw insights and apply learnings in this early and experimental phase of consumer AR.
For deeper XR data and intelligence, join ARtillry PRO and subscribe to the free ARtillry Weekly newsletter.
Disclosure: ARtillry has no financial stake in the companies mentioned in this post, nor received payment for its production. Disclosure and ethics policy can be seen here.
Header image credit: Niantic