
This post is adapted from ARtillry’s latest Intelligence Briefing, VR Usage & Consumer Attitudes. It includes some of its data and takeaways, including original survey research. More can be previewed here and subscribe for the full report.
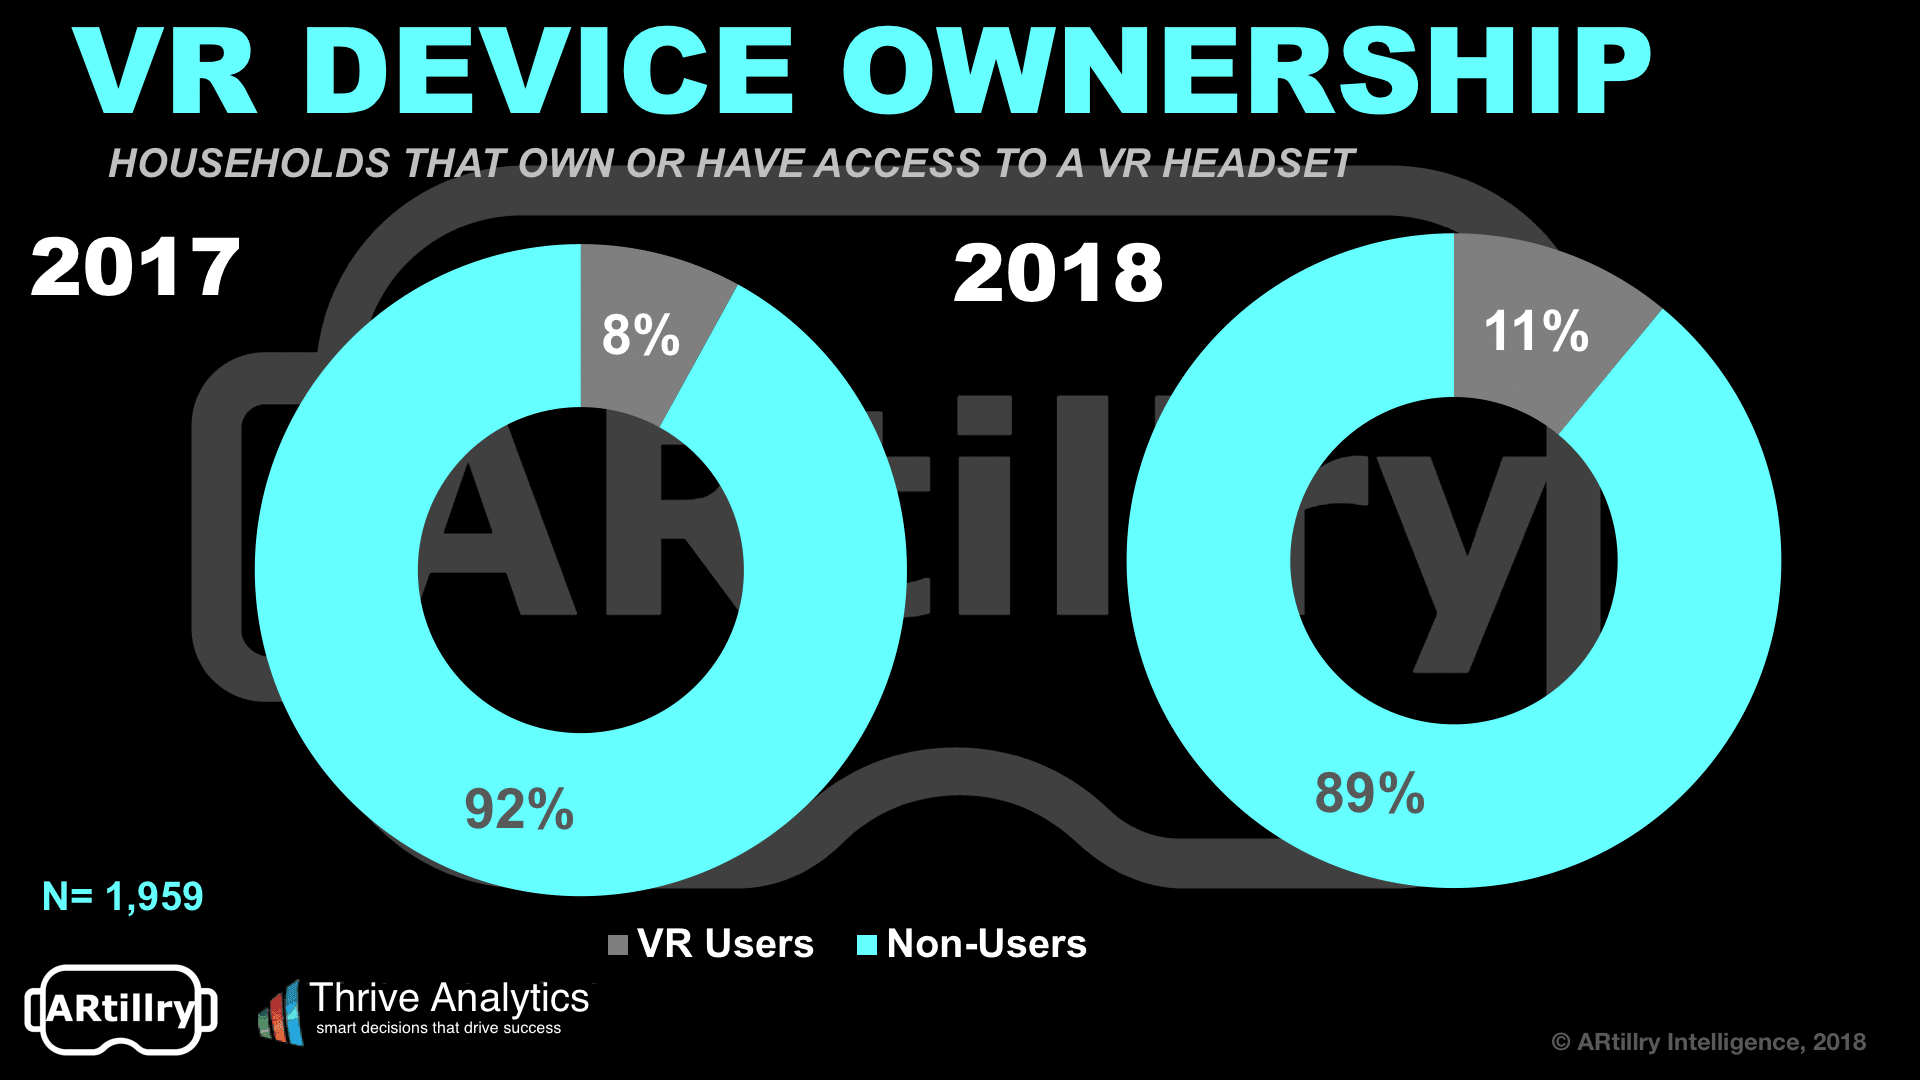
Starting our analysis at the very top, what’s the overall penetration and adoption of VR among consumers? Survey results indicate that it currently stands at about one in ten (11 percent). This aligns with headset penetration figures reported in our Global XR Forecast last month.
Thought adoption is up slightly from 2017, the three-point increase is just outside the +/- 2.25 percent margin of error and 95 percent confidence interval. Therefore, year-over-year adoption should be viewed as essentially flat. The good news: there’s still ample head room for VR to grow.
Headset Horserace
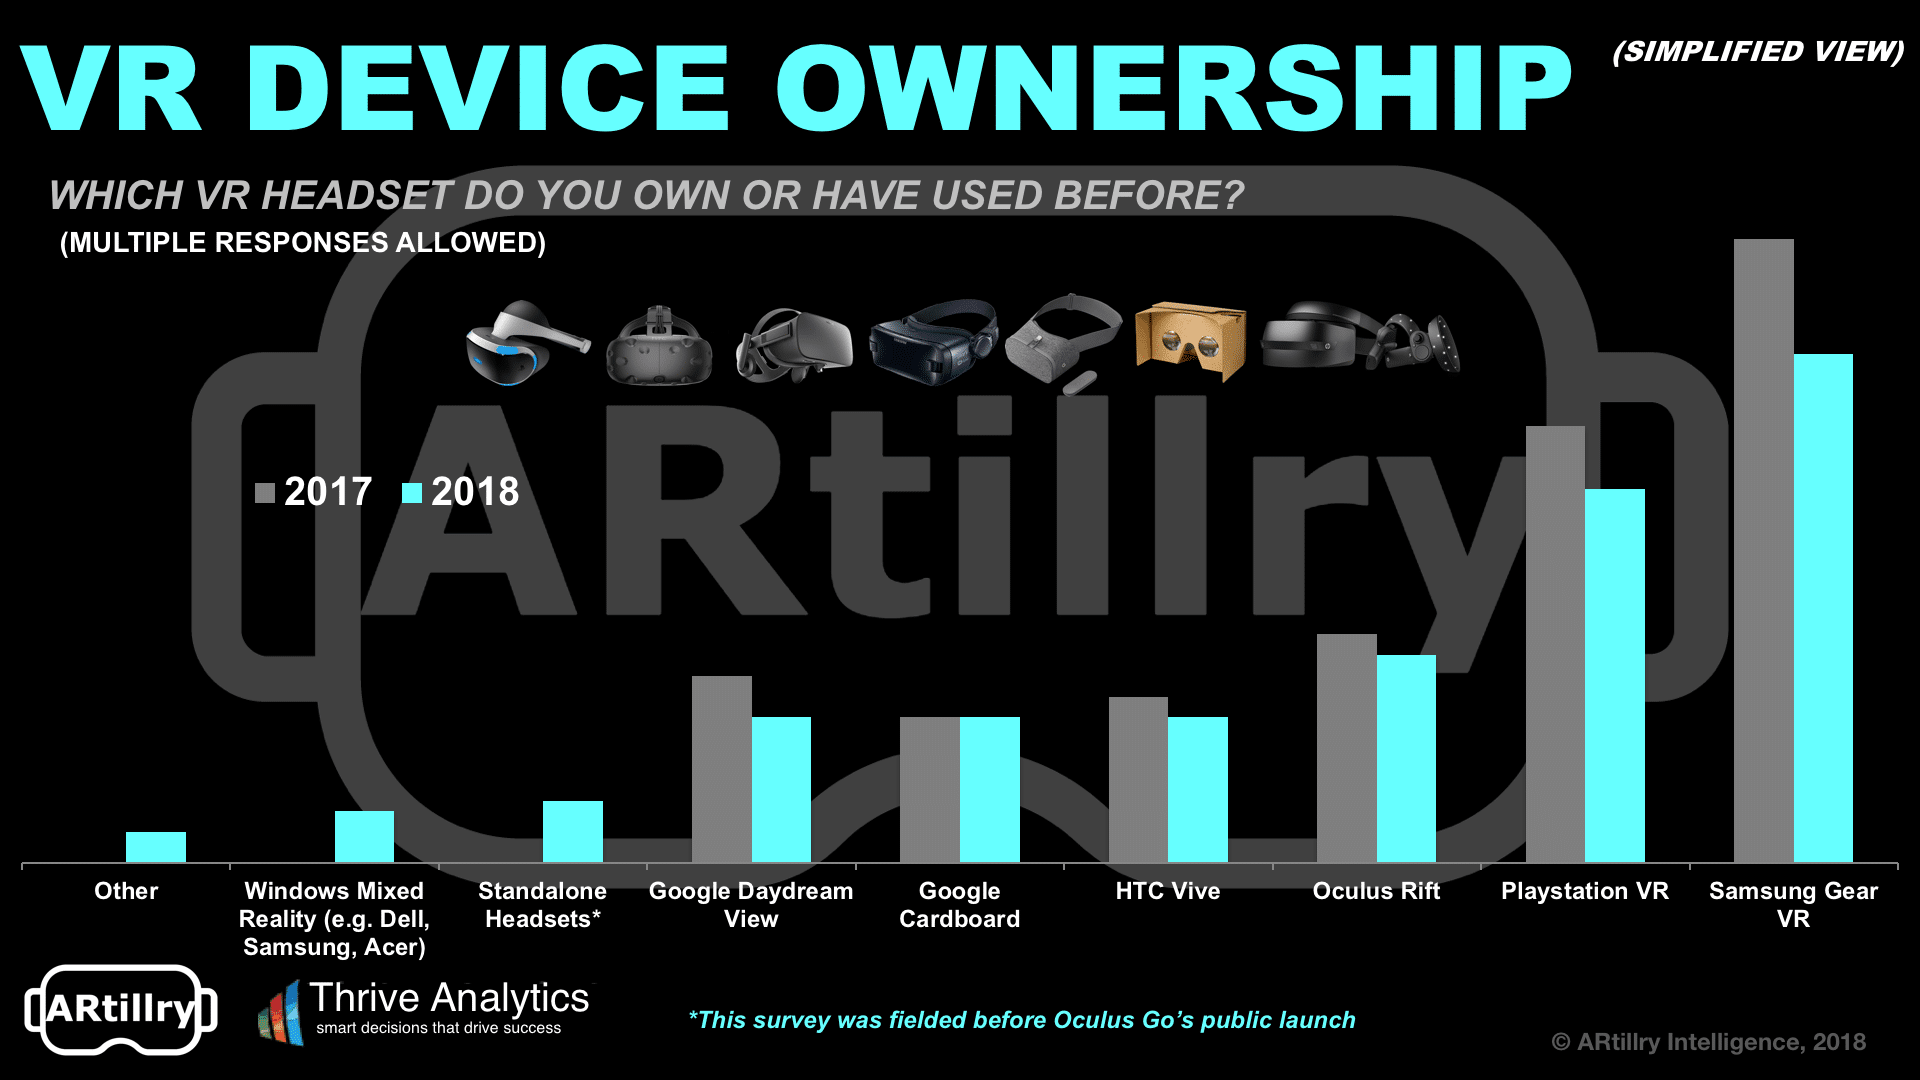
Going one level deeper, what devices are gaining the most traction? Samsung’s Gear VR scored highest at 49 percent. This isn’t surprising due to its relatively low price ($129), and large installed base of compatible Samsung smartphones. But it did decline from 2017 (more on that in a bit).
Playstation VR (PSVR) scored second highest in adoption among survey respondents (36 percent). This isn’t surprising for the same reasons stated above. Its price is low relative to other devices in its class (Rift and Vive), and it has an addressable market of 60 million PlayStation 4s.
Oculus Rift and HTC Vive had the third and fourth highest penetration. They scored lower than PSVR despite better specs – likely due to higher price and the need for a dedicated PC with costly graphical processing. There’s also setup friction (e.g. tracking equipment) especially for Vive.
Rift and Vive’s relative position is also notable. Many 2017 estimates pegged Vive’s adoption higher than Rift, such as Steam’s user hardware survey and analyst sales estimates. However, the same sources have shown Rift trending upward, which is now supported by these survey figures.
Google Cardboard scored low (14 percent) in reported adoption, which is surprising. Its pricing barrier is the lowest of the pack, and in some cases non-existent due to promotional giveaways. Therefore, low reported usage is likely due to declining interest in the once-popular device.
Following Trends
Beyond Wave II results alone, there are also telling signs in the trending factors from 2017 to 2018. Most notable is Samsung Gear VR’s sharp decline. We attribute this to two factors. First, prices have dropped for tier-1 headsets such as Rift, making higher-end VR more affordable.
The second factor is that the market is fragmenting, including the introduction of standalones and Windows MR devices. This has not only caused Gear VR’s share to fall but share losses can be seen for several VR headsets across the board, though not as steep as Gear VR.
In fact, simultaneous share reductions for several headsets seems counterintuitive. We’ve theorized that this is due to the industry’s stage. In 2017, a larger share of users were early adopters, whose savvy profile correlates with multiple-headsets (multiple responses allowed).
As VR continues to grow slowly into mainstream consumer ownership, the profile of that user base is comparatively less compulsive than tech-maven early adopters. We surmise that this is one reason that Wave II respondents appear to report a lesser number of headsets used or owned.
Looking Forward
Lastly, it’s important to note the rise of new categories tracked in this wave of research, including standalone headsets and Windows Mixed Reality headsets. These headset classes have emerged in the past year and show lots of potential, which are starting to be shown in these survey results.
Standalone headsets especially could accelerate industry sales growth by bringing more users into VR. That’s due to lower price and less friction to set up and launch VR sessions. Oculus Go in particular could be such an accelerant, though this survey was fielded before its market launch.
Its $199 price and mainstream-friendly features could give consumer VR the jumpstart it needs. As examined in ARtillry’s Global XR Forecast (and explored in the pricing section of this report), Oculus Go’s price stems from Oculus’ loss-leader pricing strategy to gain early market share.
This positioning has informed our projections for 1.3 million Oculus Go’s shipped in 2018. It will continue to grow throughout our forecast period, bringing many more consumers into VR. Meanwhile, with a giftable price point, its impact will be seen most during the holidays 2018 period.
“For $200, it’s pretty amazing,” said Tested’s Jeremy Williams. “It’s in many ways already looking better than Rift, which is a two-year-old product. Visually it’s really impressive and I think everyone who puts this on, no matter where you’re coming from in VR, will be surprised.”
For more, preview the report or subscribe to access the entire thing.
For a deeper dive on AR & VR insights, see ARtillry’s new intelligence subscription, and sign up for the free ARtillry Weekly newsletter.
Disclosure: ARtillry has no financial stake in the companies mentioned in this post, nor received payment for its production. Disclosure and ethics policy can be seen here.