
This post is adapted from ARtillery Intelligence’s latest report, VR Usage & Consumer Attitudes, Wave III. It includes some of its data and takeaways. More can be previewed here and subscribe for the full report.
How do consumers feel about VR? Who’s using it? What devices and apps do they use? And what do they want to see next? Perhaps more importantly, what are non-users’ reasons for disinterest? And how can VR players optimize product strategies accordingly?
These are key questions that our research arm ARtillery Intelligence set out to answer. Working with Thrive Analytics, they presented questions to more than 3,100 U.S. adults in Thrive’s established survey engine. And they’ve analyzed the results in a narrative report.
This follows similar reports completed over the past two years. Wave III of the research now emboldens the perspective and brings new insights and trend data to light. All three waves represent a collective base of 7,065 U.S. adults for a robust longitudinal analysis.
Picking up where we left off last week, we’ll dive into Non-VR user sentiments. Among those who haven’t adopted VR, what are their feelings towards the technology and probability of adopting? Because they’re larger in number at this stage, appealing to them is a strategic imperative.
Market Correction
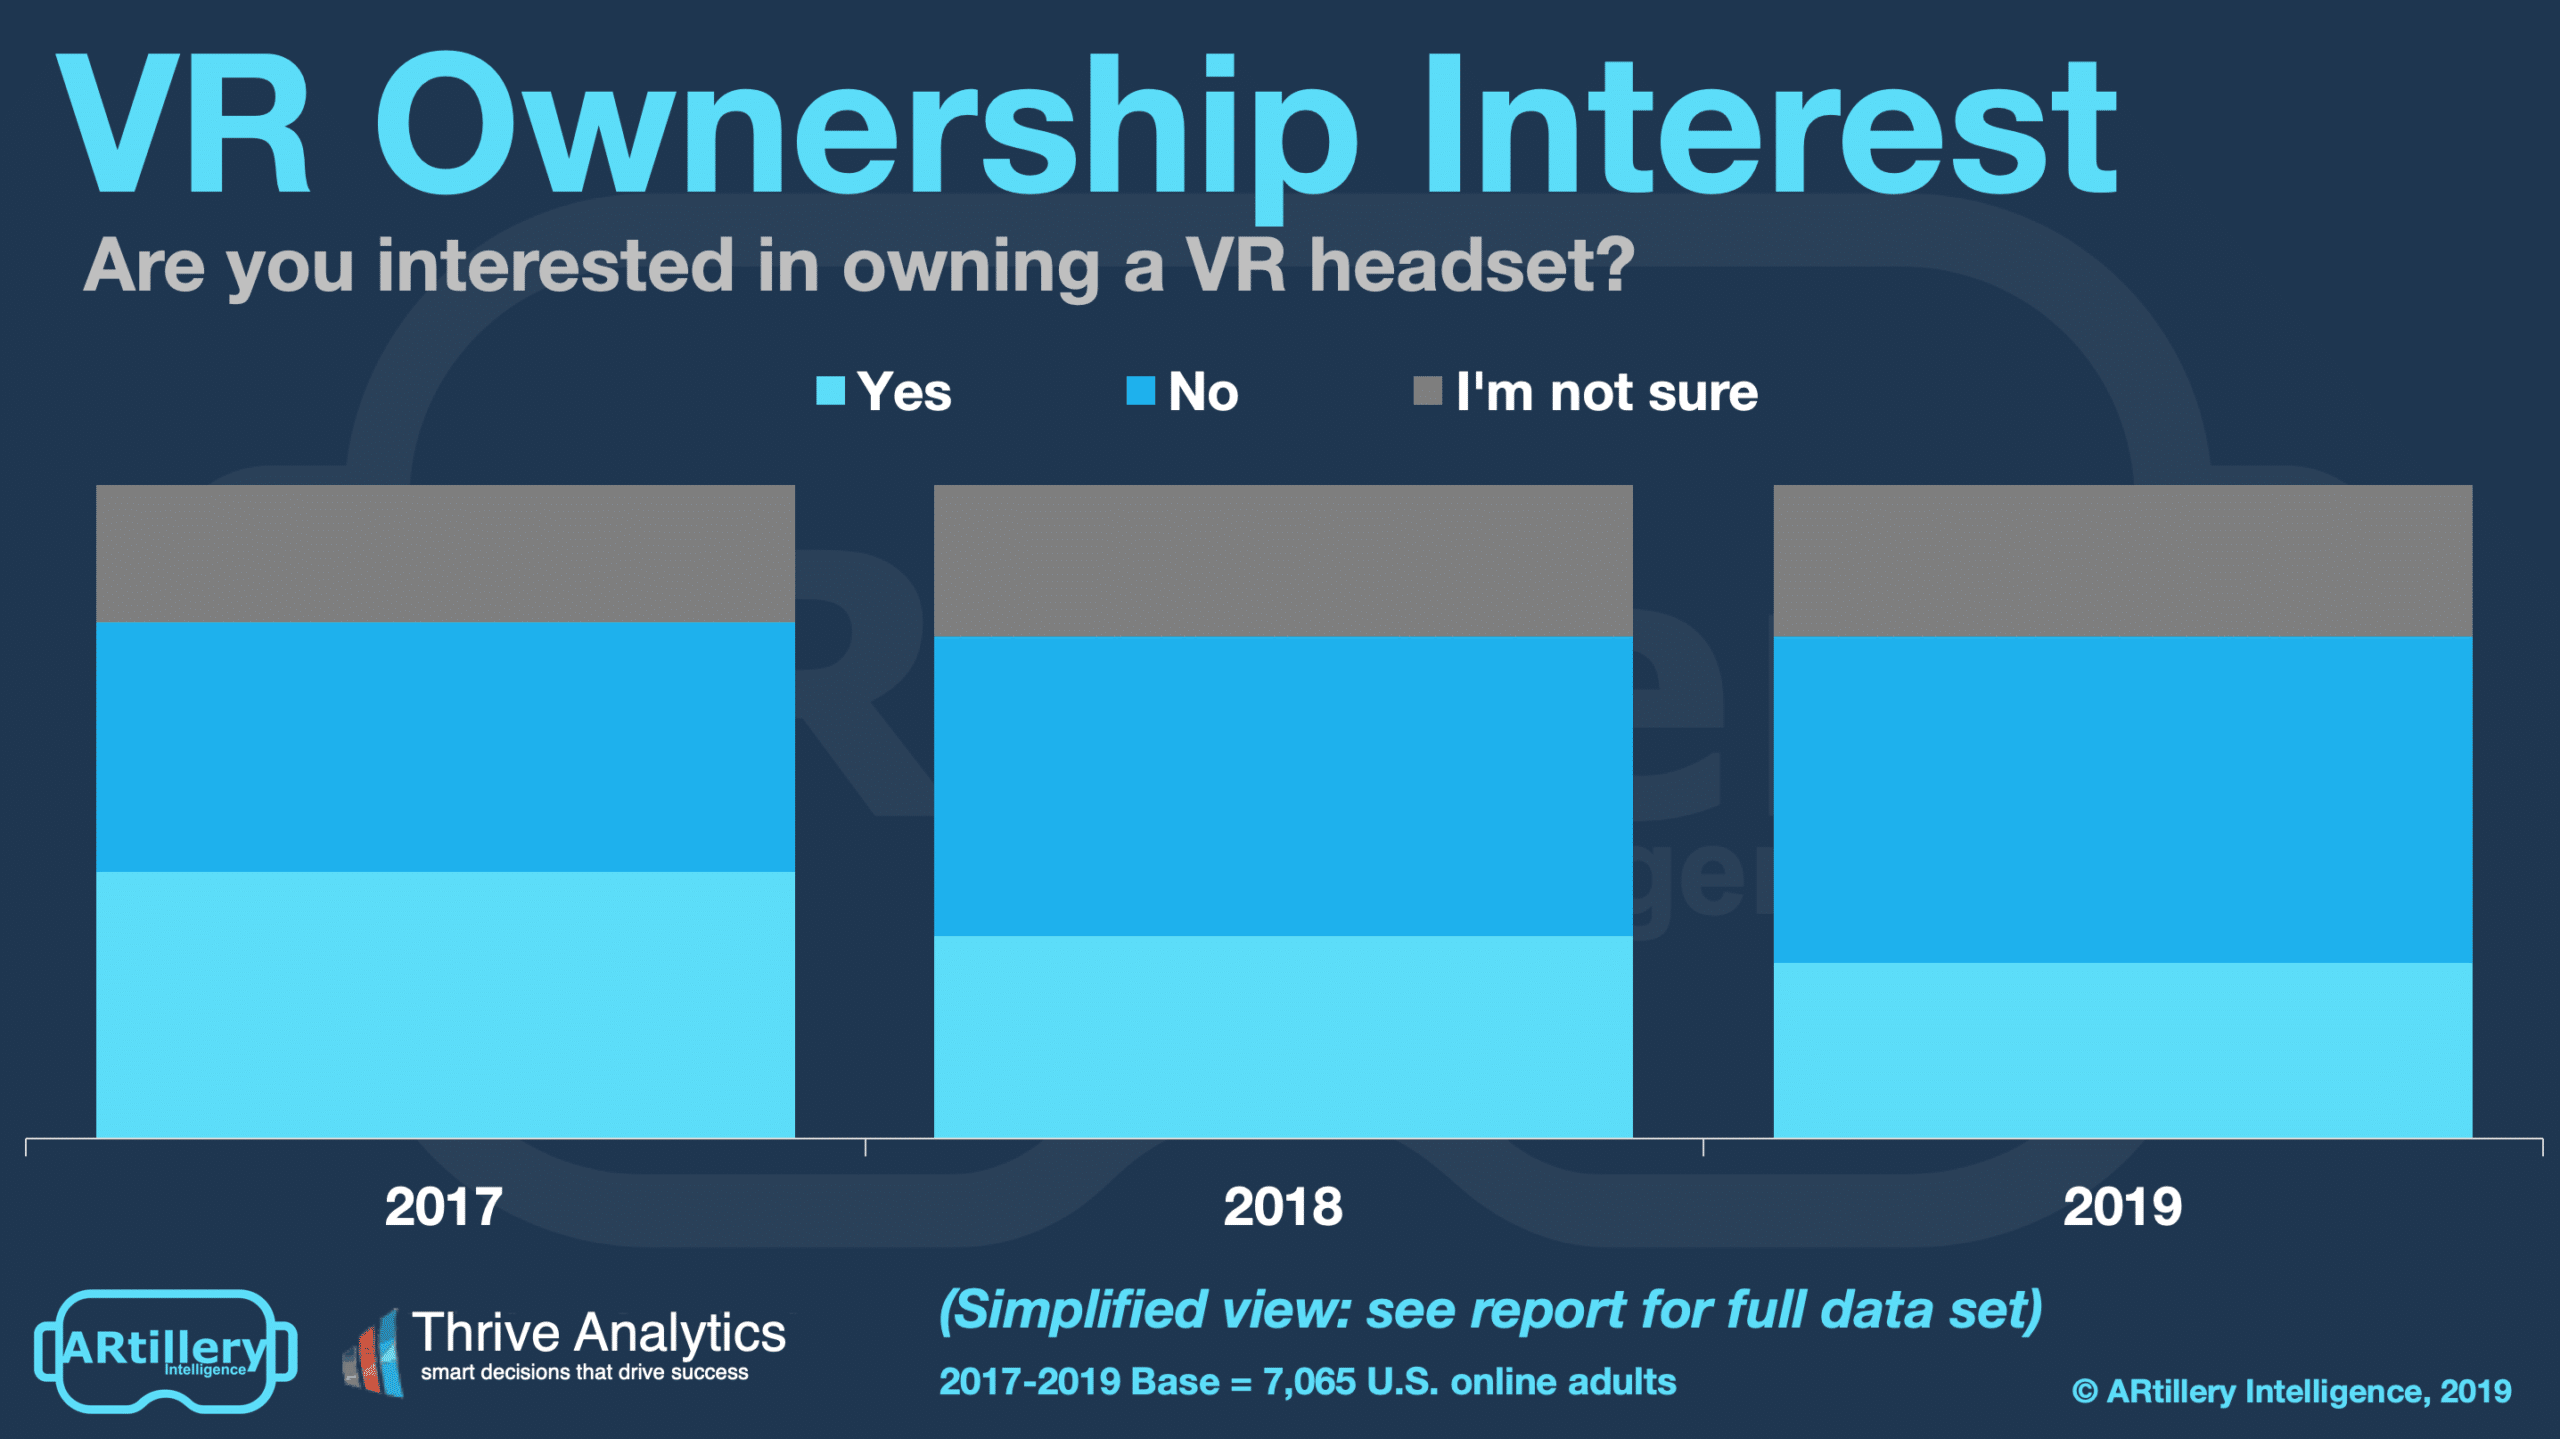
Perhaps more important than VR users, what are non-users saying? 27 percent report interest while 50 percent aren’t interested, and 23 percent aren’t sure. This is down from 31 percent in 2018 and 41 percent in 2017. This decline aligns with VR sales figured we separately track.
Another way to read these figures is a classic market correction to the hype cycle that defined 2016 and 2017. Sales continue to regress to market-reflective levels. The good news is that the market will eventually meet 2016 and 2017’s lofty expectations… but it will take several years.
It’s like the 2000’s eCommerce bubble: market projections weren’t inaccurate… they were just early. Eventual market sizes exceeded those lofty expectations, but not until 5-7 years later. We believe VR interest, and these representative survey results, will likewise bounce back.
Marketing Challenge
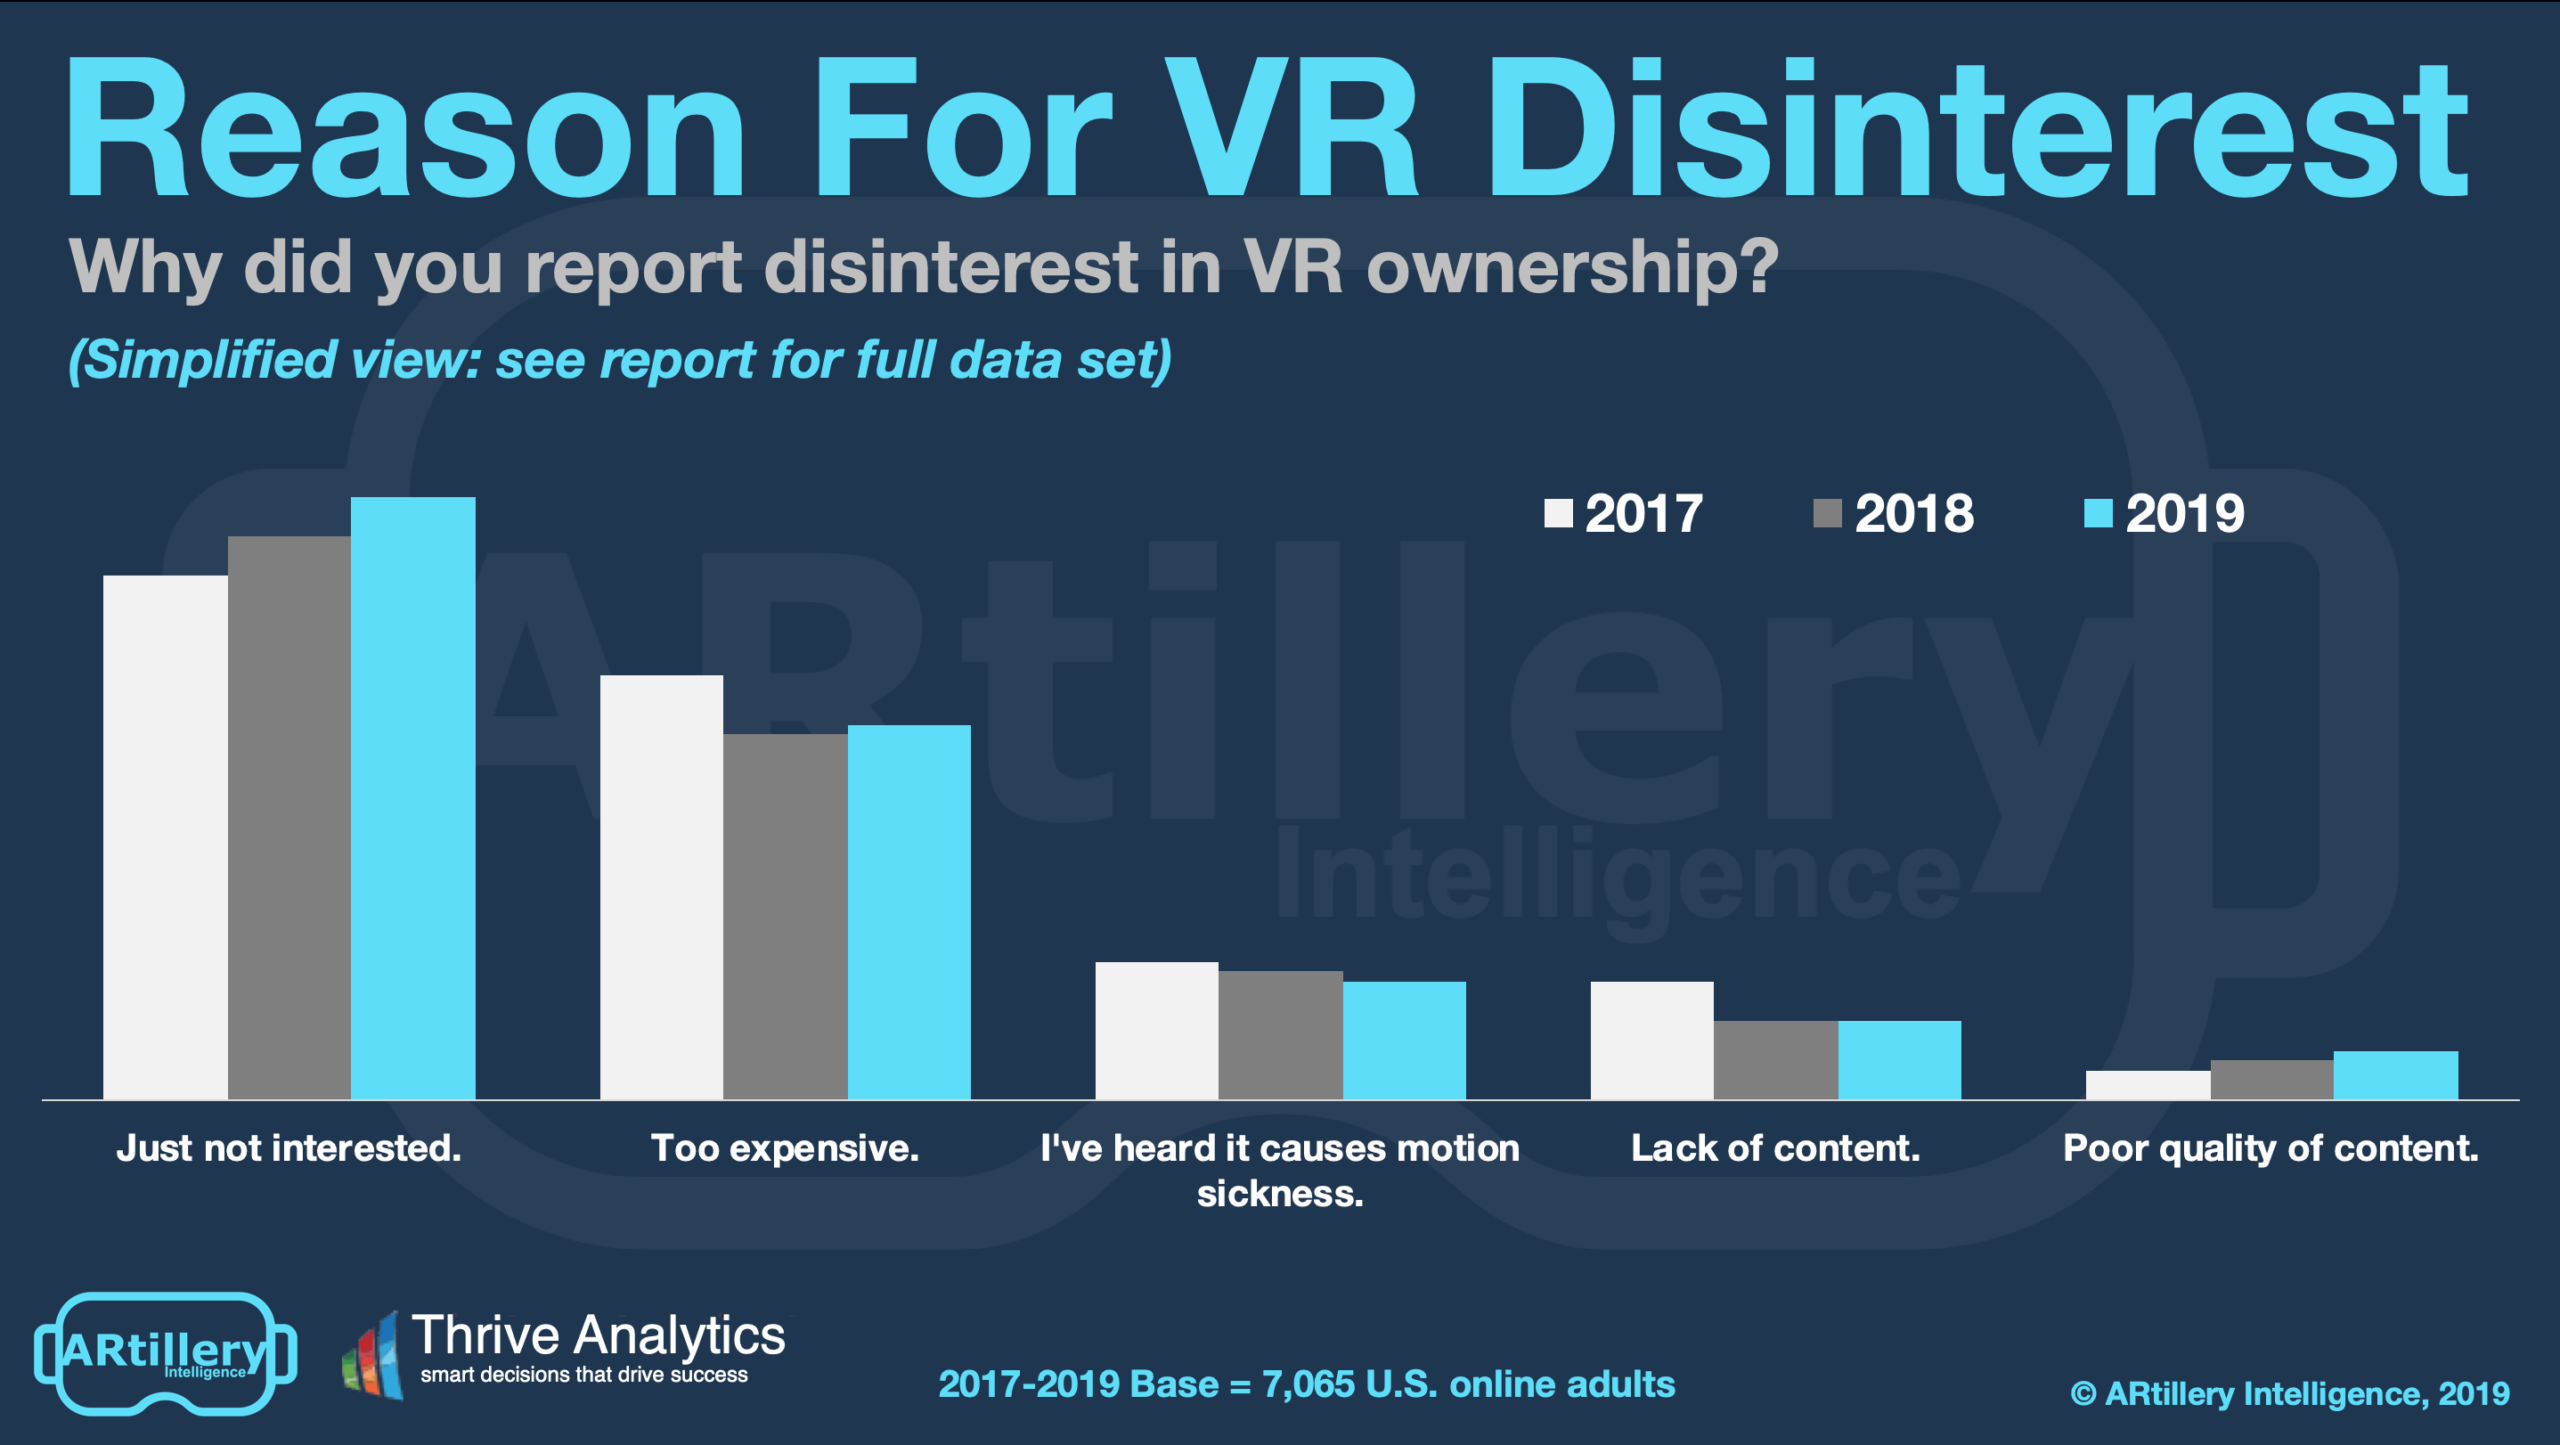
More important than binary interest levels in VR are the reasons behind them. This can shed light on non-users’ objections to VR and therefore what features and components can be changed or optimized to attract more consumers. Their objections can be a telling indication of what’s missing.
Not surprisingly, price was a factor at 38 percent (price is explored later in this report). But the biggest reason was the rather discouraging “just not interested” (61 percent). But what’s most notable is the difference between ths non-user ambivalence and VR users’ high satisfaction.
This divergence underscores VR’s marketing challenge. Its immersion is its greatest strength in captivating users. But it’s also the greatest weakness in that the experience can’t be captured through traditional marketing. As we like to say, it’s like “selling TVs on the radio.”
This challenge is exacerbated by VR’s set-up friction and technological invasiveness. Getting people to try it – after which they’re often converted – is made more difficult given all that activation energy. This includes things like setting up tracking systems and other moving parts.
This is yet another reason we’re bullish on standalone VR. Its lack of friction will bring that “first taste” to more consumers. That’s the case for Oculus Go but will be even more so with Quest. It walks a fine line between user-friendliness and high-end VR functionality.
Cross Section
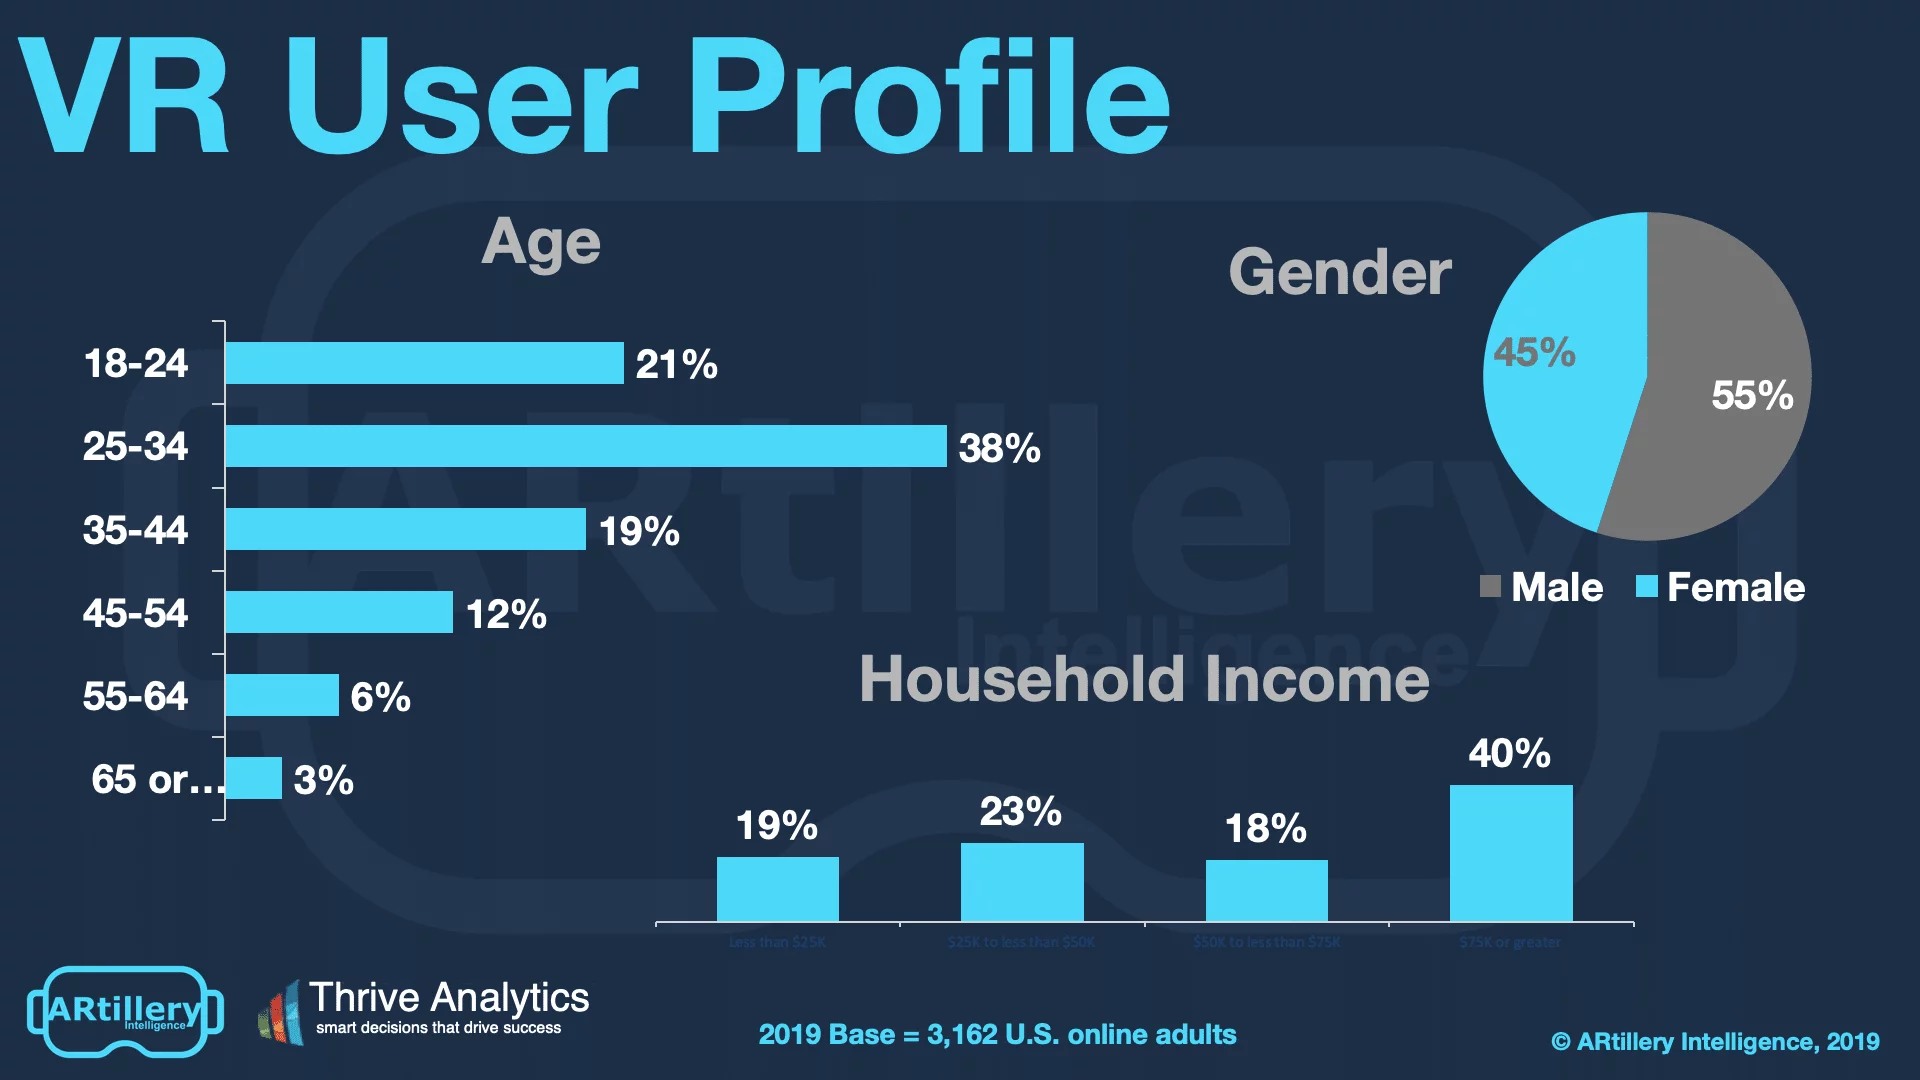
To add context to survey findings throughout this report, who’s answering the questions? It includes more than 3,100 U.S. adults. Going deeper into demographics and psychographics, the respondents break down as shown below. More detail and segmentation are available on request.
The survey sample spans a wide range of U.S. adult consumers. Gender breaks down fairly evenly, while age and income levels skew towards more attractive demographic groups. That includes active and buying-empowered age groups (25-34), and high-income homes ($75K+).
See more details about this report or continue reading here.
For deeper XR data and intelligence, join ARtillery PRO and subscribe to the free AR Insider Weekly newsletter.
Disclosure: AR Insider has no financial stake in the companies mentioned in this post, nor received payment for its production. Disclosure and ethics policy can be seen here.