
This post is adapted from ARtillery Intelligence’s latest report, VR Usage & Consumer Attitudes, Wave III. It includes some of its data and takeaways. More can be previewed here and subscribe for the full report.
How do consumers feel about VR? Who’s using it? What devices and apps do they use? And what do they want to see next? Perhaps more importantly, what are non-users’ reasons for disinterest? And how can VR players optimize product strategies accordingly?
These are key questions that our research arm ARtillery Intelligence set out to answer. Working with Thrive Analytics, they presented questions to more than 3,100 U.S. adults in Thrive’s established survey engine. And they’ve analyzed the results in a narrative report.
This follows similar reports completed over the past two years. Wave III of the research now emboldens the perspective and brings new insights and trend data to light. All three waves represent a collective base of 7,065 U.S. adults for a robust longitudinal analysis.
This week, we’ll dive into the breakdown of VR users satisfaction levels — overall and arrayed by headset.

Making a Mark
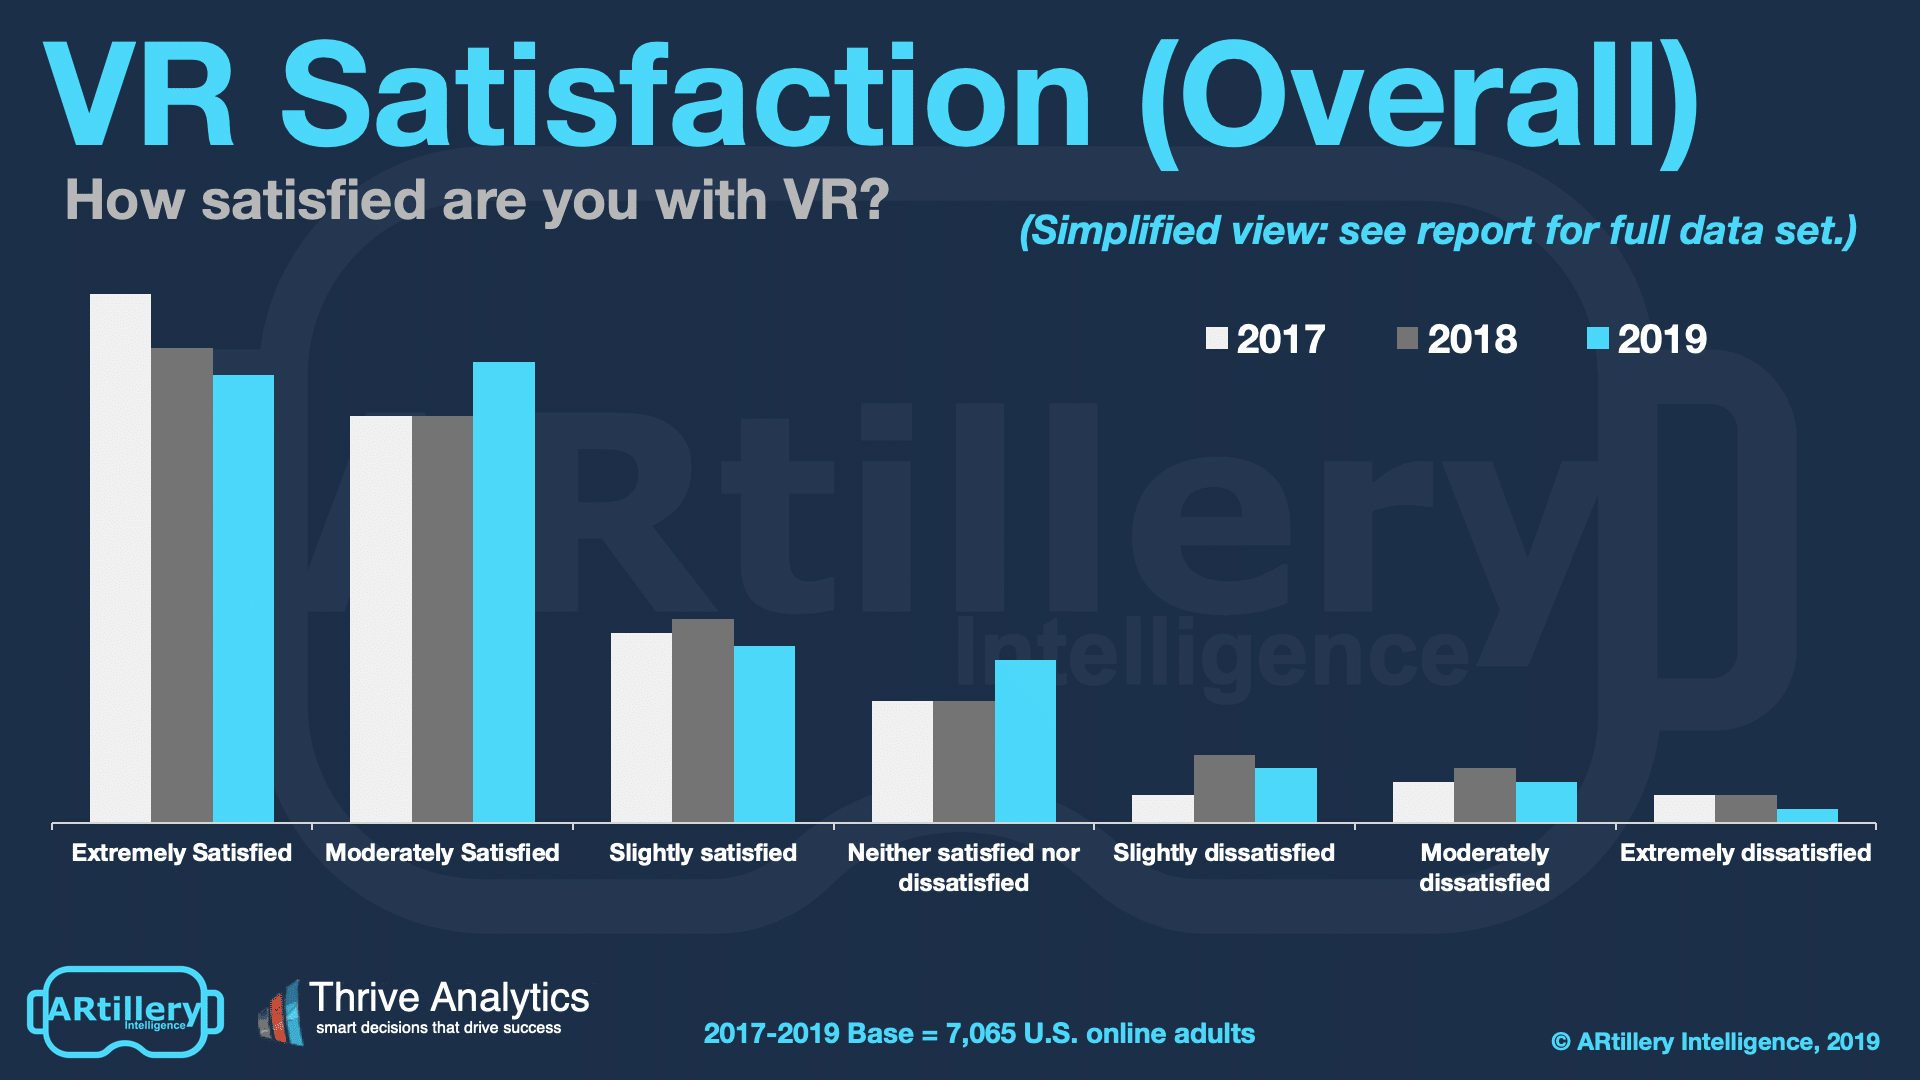
Picking up where we left off last week, how are consumers satisfied with VR? Satisfaction levels align with the growing affinity for standalone VR. But before getting into per-headset sentiments, it’s worth noting that overall VR satisfaction remains mostly favorable.
Specifically, 67 percent of users are either moderately satisfied (34 percent) or extremely satisfied (33 percent). This contrasts the opposite end of the satisfaction spectrum where only 4 percent of users are either moderately dissatisfied (3 percent) or extremely dissatisfied (1 percent).
These are strong quality signals. In fact, there are few consumer products that show such high satisfaction levels. However, we should note that the corresponding results in our April mobile AR report showed even higher satisfaction levels, with 78 percent of users satisfied or very satisfied.
This tells us that that VR’s highly visual and immersive format, though still early, is already captivating users. This is due to its revolutionary – rather than evolutionary – interface when compared with traditional 2D media to which users are accustomed.
To be fair, extremely-satisfied responses are down nine percentage points from a 2017 peak of 39 percent. This is likely due to the excitement levels that surrounded VR circa-2017, which have since receded. But the dip is partially offset by a small increase in moderately-satisfied responses.
Naming Names
Drilling down another level, how do satisfaction ratings map to individual devices? Answering that question can start to indicate the VR features and formats that resonate most with consumers. The high-level takeaway is that satisfaction is high across the board, with some variance.
When ranking headsets by those that received “moderate” or “extreme” satisfaction, Windows Mixed Reality (WMR) leads the pack (87%), followed by Oculus Rift (83%) and Go (83%). This is surprising given that WMR headsets vary in quality and aren’t known to be the gold standard.
That designation rather goes to Oculus, given its VR investments. In fact, its approach to “trade margins for market share,” has generally allowed it to market headsets that are technically superior to others in their price classes. That’s reflected in these survey sentiments.
HTC VIVE meanwhile underperformed in terms of lower high-satisfaction scores and higher low-satisfaction scores. This could be partly due to VIVE’s outside-in tracking system, known to be the most cumbersome. Consumers are getting a taste of frictionless VR, which is shifting standards.
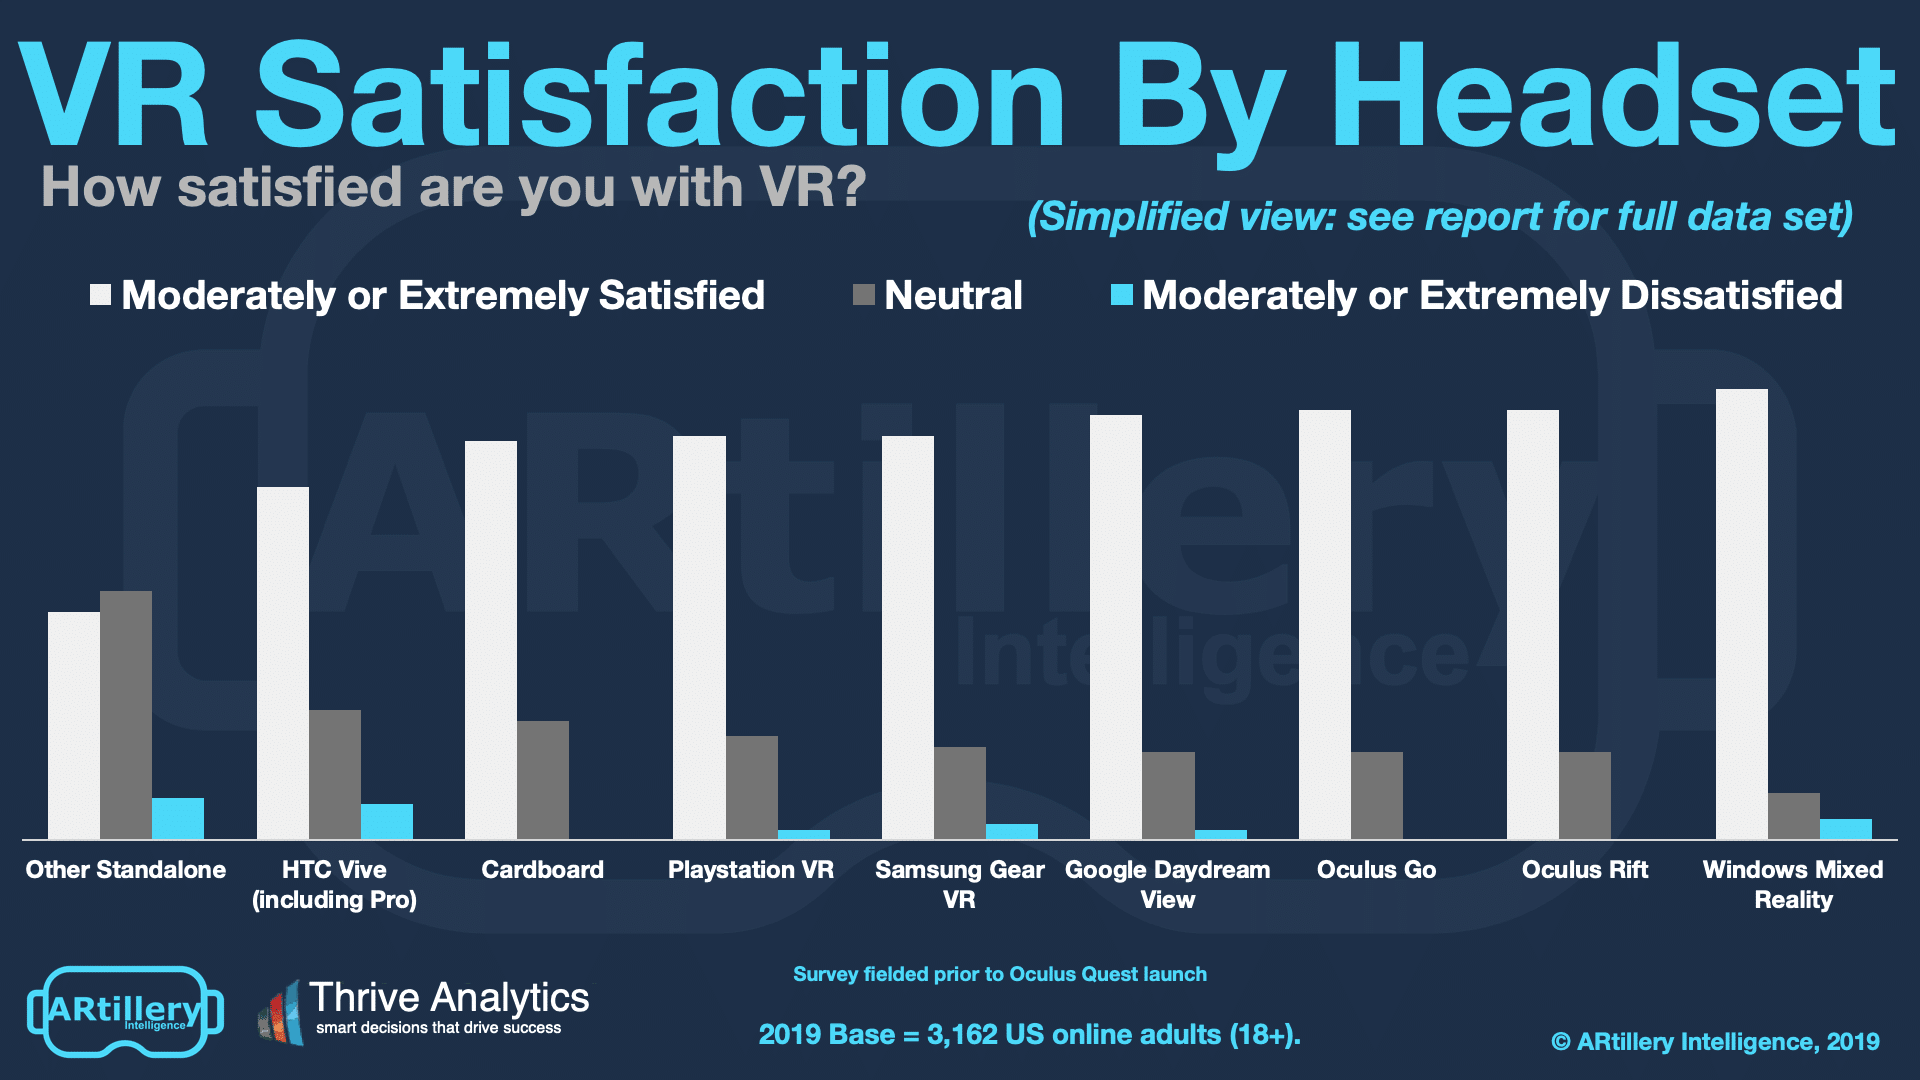
Meanwhile, surprises include high satisfaction for cardboard (77%) and the increasingly- neglected Daydream View (82%). Google’s disappointing adoption for the latter has caused it to redeploy support resources, resulting in a substandard content library and uncertain future.
Another takeaway from these satisfaction rankings – continuing the theme of the rise of standalone VR – is that the category is resonating with users. This considers Oculus Go’s high marks. “Other standalone” scored lowest but that’s expected.
On both of these points, we wrote in last year’s report:
Standalone VR scored lowest, which makes sense for one reason: This survey was fielded before Oculus Go’s launch, during a time when standalone VR was characterized by lower-quality devices.
We believe strongly that this survey’s next wave will identify the standalone category with much greater satisfaction ratings, due to Oculus Go. In our ongoing use and testing of Oculus Go, it has impressed us in quality levels and price, due mostly to Oculus’ investments discussed above.
Cross Section
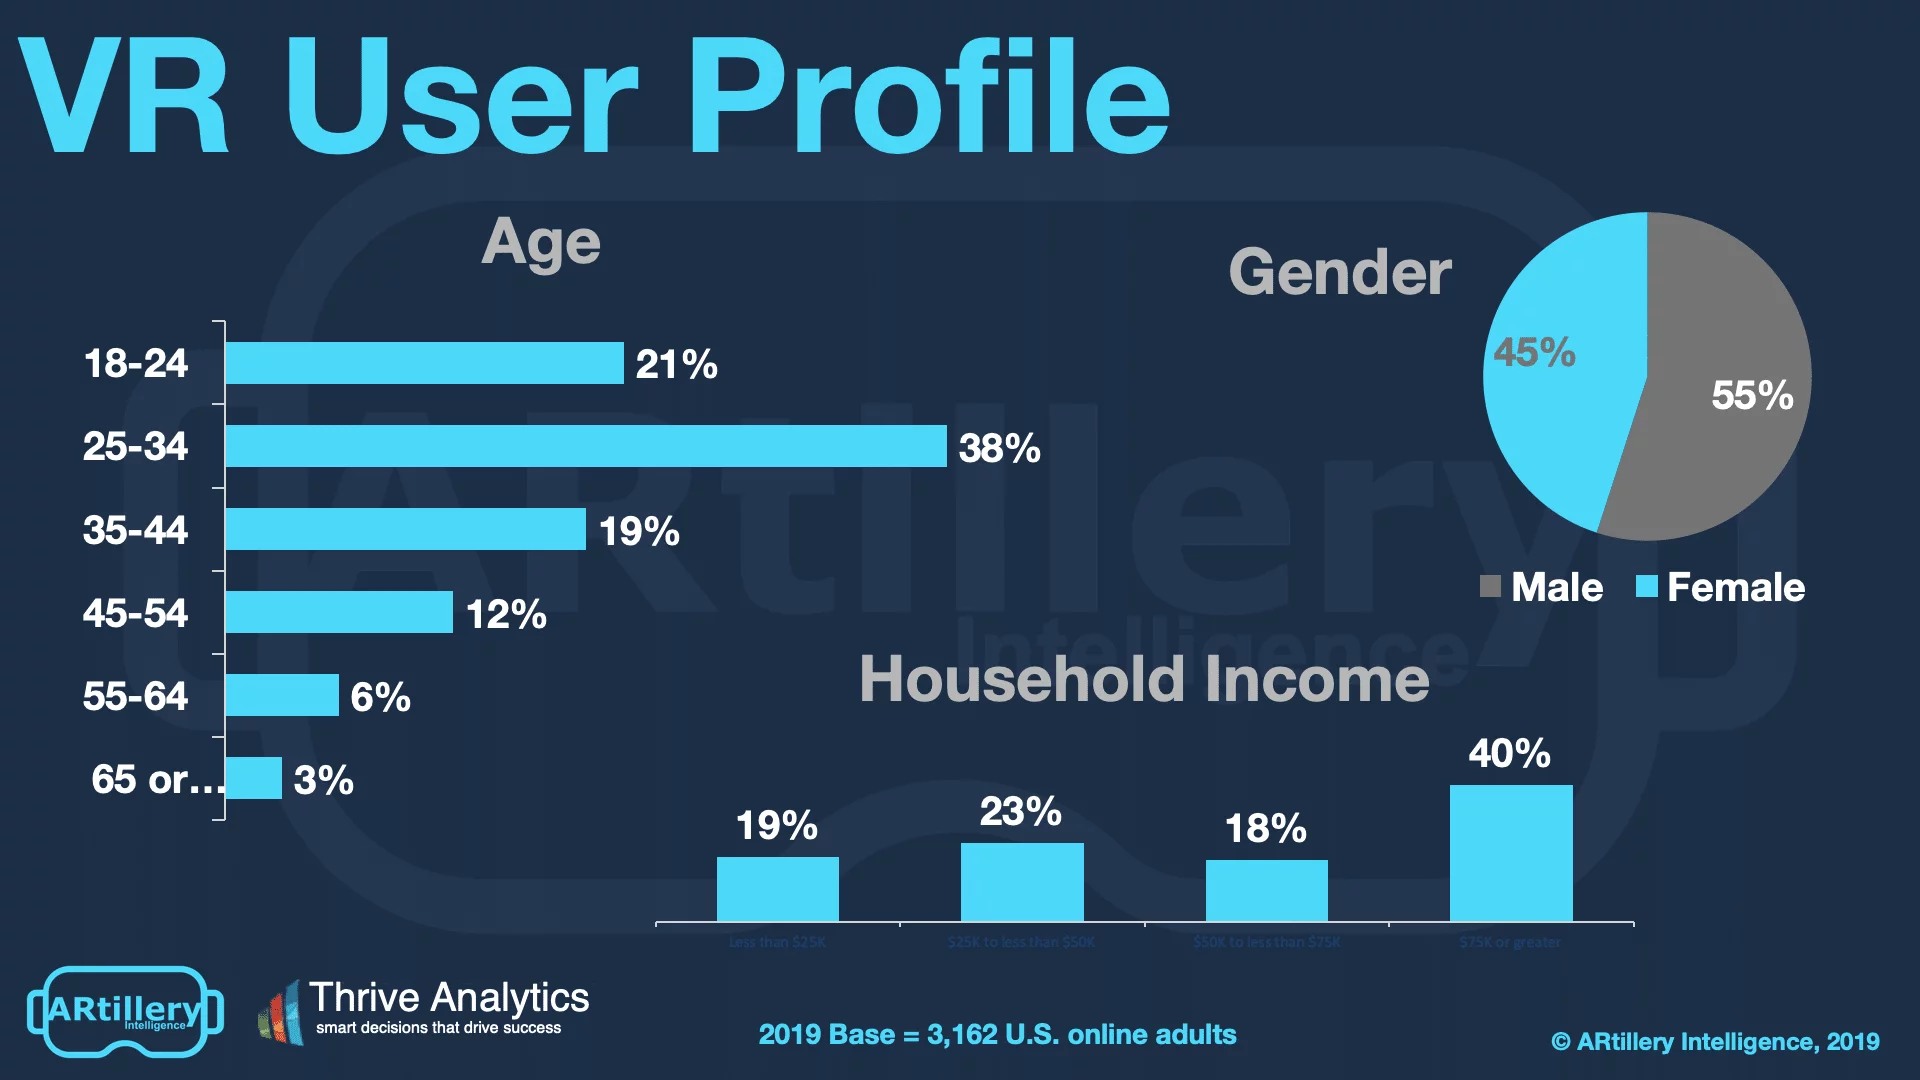
To add context to survey findings throughout this report, who’s answering the questions? It includes more than 3,100 U.S. adults. Going deeper into demographics and psychographics, the respondents break down as shown below. More detail and segmentation are available on request.
The survey sample spans a wide range of U.S. adult consumers. Gender breaks down fairly evenly, while age and income levels skew towards more attractive demographic groups. That includes active and buying-empowered age groups (25-34), and high-income homes ($75K+).
See more details about this report or continue reading here.
For deeper XR data and intelligence, join ARtillery PRO and subscribe to the free AR Insider Weekly newsletter.
Disclosure: AR Insider has no financial stake in the companies mentioned in this post, nor received payment for its production. Disclosure and ethics policy can be seen here.