
Data Point of the Week is AR Insider’s dive into the latest spatial computing figures. It includes data points, along with narrative insights and takeaways. For an indexed collection of data and reports, subscribe to ARtillery Pro.
One downside of mobile AR is the upheld-phone orientation. Many have theorized, including us, that this will diminish AR content and ad distribution, given that session lengths are shorter than non-AR mobile experiences, such as games (6.8 minutes) and social (2.5 minutes).
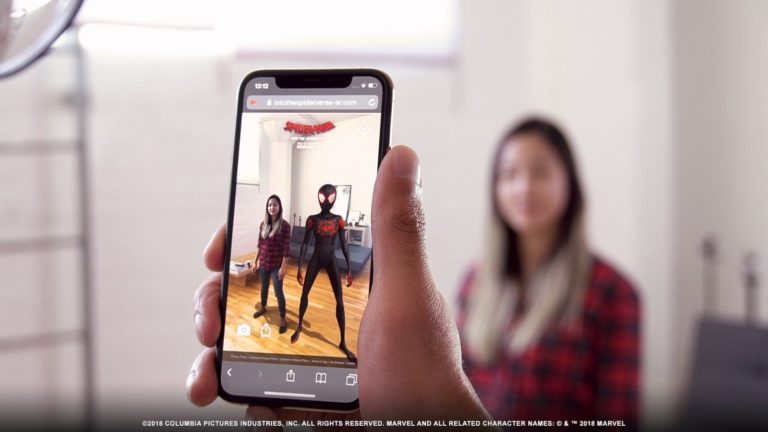
That concept stands, but there’s growing evidence that the experienced may not be as “diminished” as we thought. 8th Wall reports that 80 percent of users of its AR activations had session lengths greater than one minute and 50 percent were greater than two minutes.
This involves web AR (8th Wall’s jam) that’s mostly through the rear-facing camera, but it’s representative of most rear-facing mobile AR so reported figures can be a decent benchmark for expected outcomes elsewhere. It also has a sample size of more than 5,000 web AR apps.
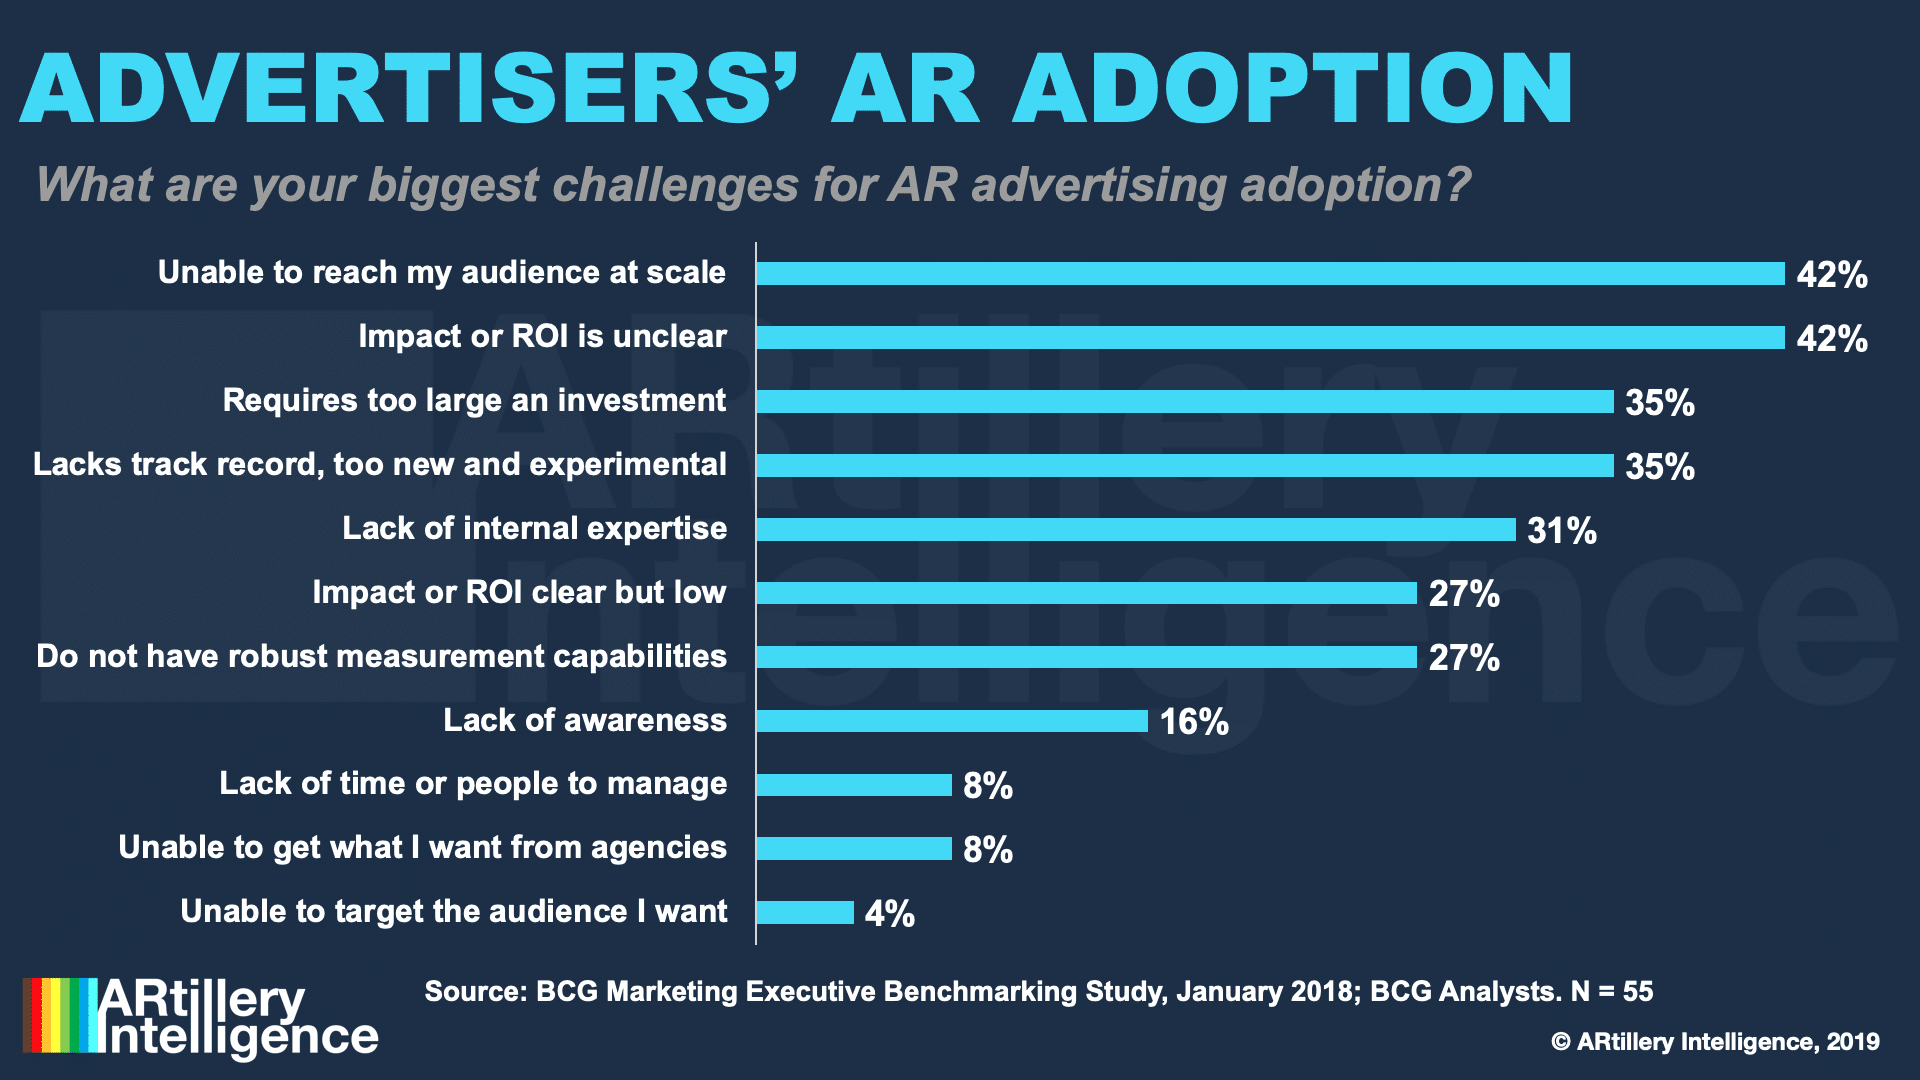
Figures like this are important to establish such benchmarks for AR performance. Moreover standard units like session lengths are important to assign value to engagement levels that advertisers can expect. Their biggest current aversion to AR is inclarity of effectiveness and ROI.
This brings up another question: What are the right metrics for AR engagement? The humble click-through-rate (CTR) survives to this day, despite its incongruence with many forms of mobile media. AR engagement around things like product try-ons won’t accurately be captured by CTRs.
“With immersive technology, everyone’s going to ask for the ROI,” said You Are Here Labs’ futurist Kathy Hackl at AWE. “Do we need to create new metrics… something like return on engagement or whatever that would translate to? There’s definitely going to be new metrics.”
One of those metrics that can capture greater dimensions of engagement is session lengths, which brings us back to the 8th Wall data. In a recent discussion with AR advertising innovator Poplar, we speculated on available metrics and agreed that session lengths are a good start.
Eventually, AR advertising and marketing will need more native and representative metrics. In addition to session lengths, that could include biometric sentiment analysis using computer vision (given that faces are sometimes in frame). And frequency of sessions is another basic indicator.
Ecommerce purchases that result from AR product try-ons are obviously a strong ROI signal that capture the full purchase funnel. But eCommerce represents about 11 percent of U.S. retail spending, so tracking “online to offline” purchases will also be valuable (not a new challenge).
Meanwhile, it’s valuable to see metrics for AR’s effectiveness such as the 8th Wall session length data. These proof points will continue to build and paint a larger mosaic of data that the advertising industry can use to build greater levels of confidence about where to place their chips.
For deeper XR data and intelligence, join ARtillery PRO and subscribe to the free AR Insider Weekly newsletter.
Disclosure: AR Insider has no financial stake in the companies mentioned in this post, nor received payment for its production. Disclosure and ethics policy can be seen here.