

 XR Talks is a series that features the best presentations and educational videos from the XR universe. It includes embedded video, narrative analysis and top takeaways. Speakers’ opinions are their own. For a full library of indexed and educational media, subscribe to ARtillery PRO.
AR continues to demonstrate its strength as a product visualization tool. This applies to AR advertising, which our research arm ARtillery Intelligence projects to grow to $1.4 billion this year. AR is also demonstrating value as a commerce tool to drive physical and digital shopping.
You may be thinking, ‘what’s the difference between AR advertising and AR commerce?’ They often look the same and flow into each other, but there are differences. These differences are mostly relevant to geeks like us that put things in buckets for the purposes of market sizing.
In short, AR advertising involves paid distribution while AR commerce involves brands’ self-distributed AR (e.g. IKEA Place app). In both cases, it involves AR lenses or visual search for “upper-funnel” brand awareness; or “lower-funnel” product visualization and purchases.
After spending lots of time examining AR advertising in these pages, we’ll focus today on what’s specifically happening in AR commerce. This was the topic of a recent research presentation by ARtillery Intelligence, which we’re featuring in this week’s XR Talks (video & takeaways below).
Key Accelerants
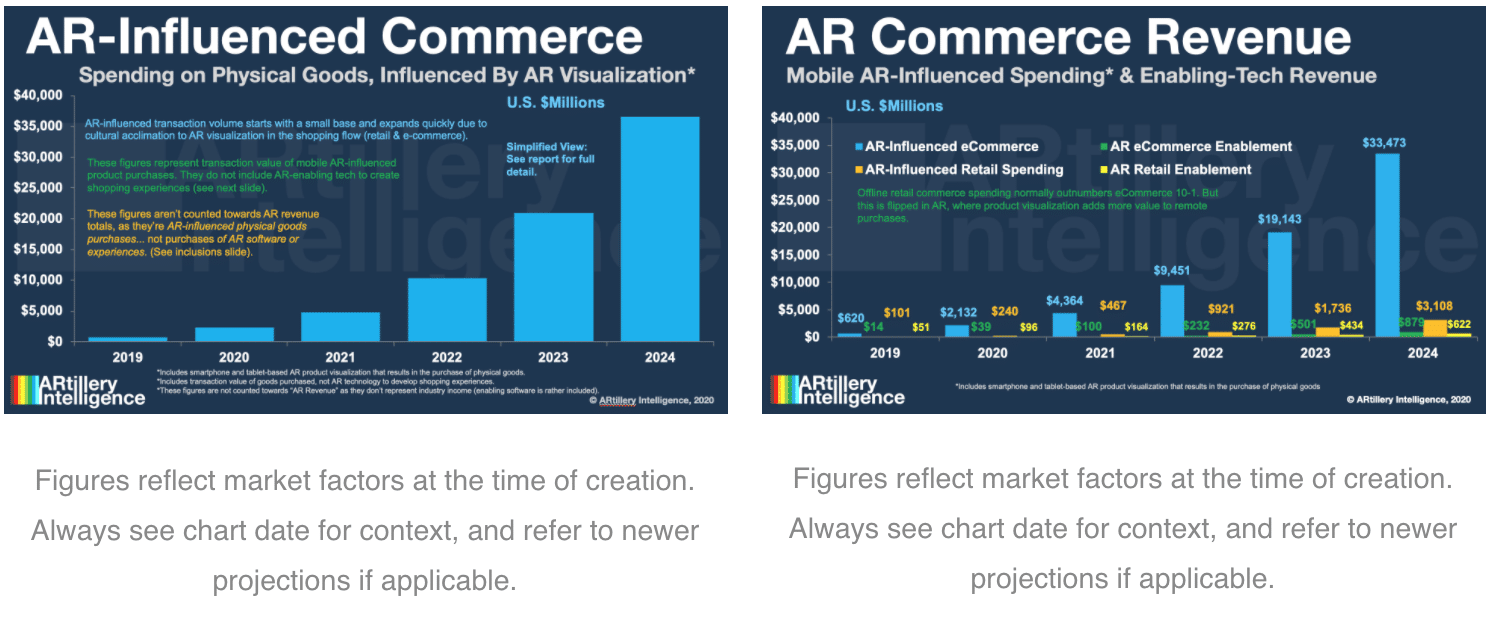
First off, how big is AR commerce? ARtillery Intelligence projects $36 billion in consumer spending to be influenced or aided by AR by 2024. To clarify, this isn’t “AR revenue” but rather the total transaction value of goods purchased that involved AR visualization in the purchase path.
AR revenue does come into play in the enablement software that helps drive that $36 billion. This involves AR commerce startups that work with brands; provide software to create 3D models, build AR experiences; or other functions in the developing AR commerce value chain.
Back to the $36 billion, it will grow rapidly from a small base (starting at almost zero). This projection is informed by several inputs and market signals such as the adoption pace of brands and retailers, and investment from tech giants like Google to accelerate it.
Another key accelerant worth mentioning is Covid-era retail lockdowns. Though it has a detrimental effect on several sectors, it could accelerate AR’s role as a shopping utility. Visualizing products in 3D gains value when we’ve lost the ability to try them on in physical stores.
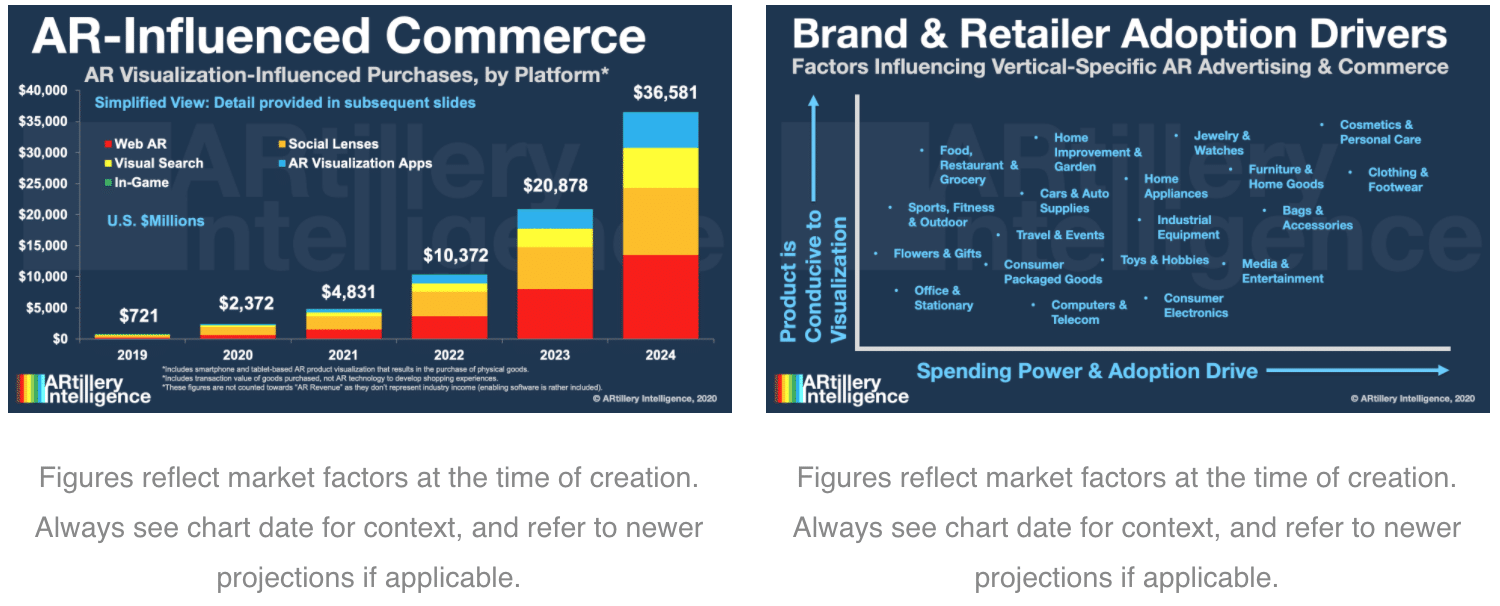
As for channels, it’s a mix of social, visual search, apps and Web AR. The latter will pull ahead in later years due to less friction, and easy activation from web links and QR codes. We’re also tracking Apple and Google moves that signal AR commerce’s likely web-based orientation.
Lastly, what verticals will be most adaptive to AR commerce? They’ll map to a combination of brands’ motivation to adopt, as well as product conduciveness to AR visualization (see chart below). Exemplars so far include cosmetics, clothing, jewelry, furniture and home goods.
From the Source
All of the above is extracted from ARtillery’s Global Mobile AR Revenue Forecast. But a separate set of insights flows from its survey research. In partnership with Thrive Analytics, it fields an annual survey of more than 1,000 U.S. adults on their mobile AR usage patterns and attitudes.
For example, among those who use mobile AR, what formats are they engaging with? AR-as-a-Feature took the lead for the second year in a row. This consists of AR features in non-AR apps like Snapchat Lenses. This stands to reason because it lets AR piggyback on established apps.
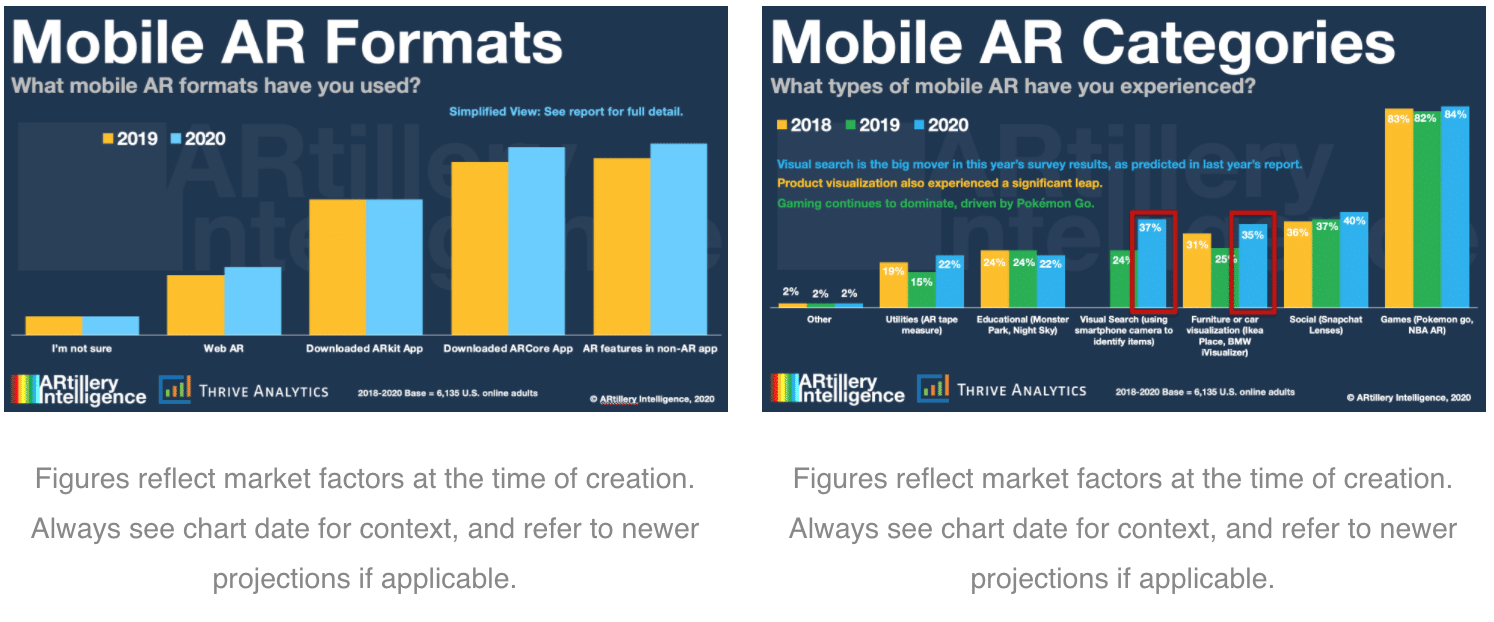
Drilling down one level, what types of app categories and content are resonating most? Gaming continues to lead the pack for the third year in a row, followed by Social AR. But back to the theme of AR commerce, visual search and product visualization have both spiked over past year.
This aligns with our ongoing theory that AR will move into more utilitarian and high-frequency use cases as the technology matures, including shopping utilities. That premise is further supported in the survey results that show visual search among the most high-frequency AR activities.
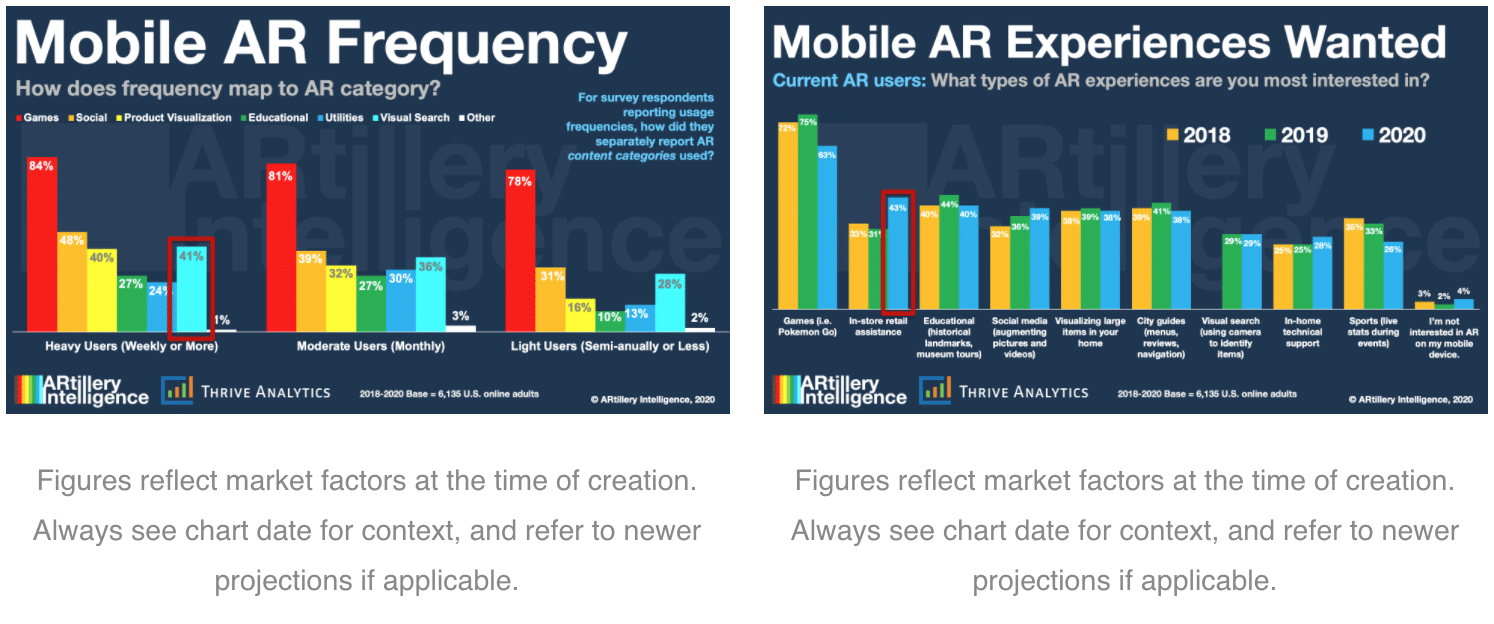
AR-based Shopping also comes up in consumer sentiments about what they want to see next. Overall, gaming leads these aspirational AR use cases, followed long tail of evenly-distributed affinity areas like social media, city guides, AR shopping and in-home tech support (see above).
But it’s also notable that gaming is trending down year over year, while in-store AR shopping is trending up. Though eCommerce gets more attention when it comes to AR, this in-store retail use case could be powerful, especially as a way to support post-Covid “touchless” retail.
That covers some of the presentation highlights. For more charts and narrative analysis, see the full presentation below. Also see the full reports cited above and in the presentation: Mobile AR Global Revenue Forecast, 2019-2014; and Mobile AR Usage & Consumer Attitudes, Wave III.