
![]() This post is adapted from ARtillery Intelligence’s report, AR Advertising Deep Dive, Part I: The Landscape. It includes some of its data and takeaways. More can be previewed here and subscribe for the full report.
This post is adapted from ARtillery Intelligence’s report, AR Advertising Deep Dive, Part I: The Landscape. It includes some of its data and takeaways. More can be previewed here and subscribe for the full report.
AR continues to evolve and take shape as an industry. Prominent sectors include industrial AR, social, gaming, and shopping. But existing alongside all of them is AR advertising. This includes paid/sponsored AR lenses that let consumers visualize products on “spaces & faces.”
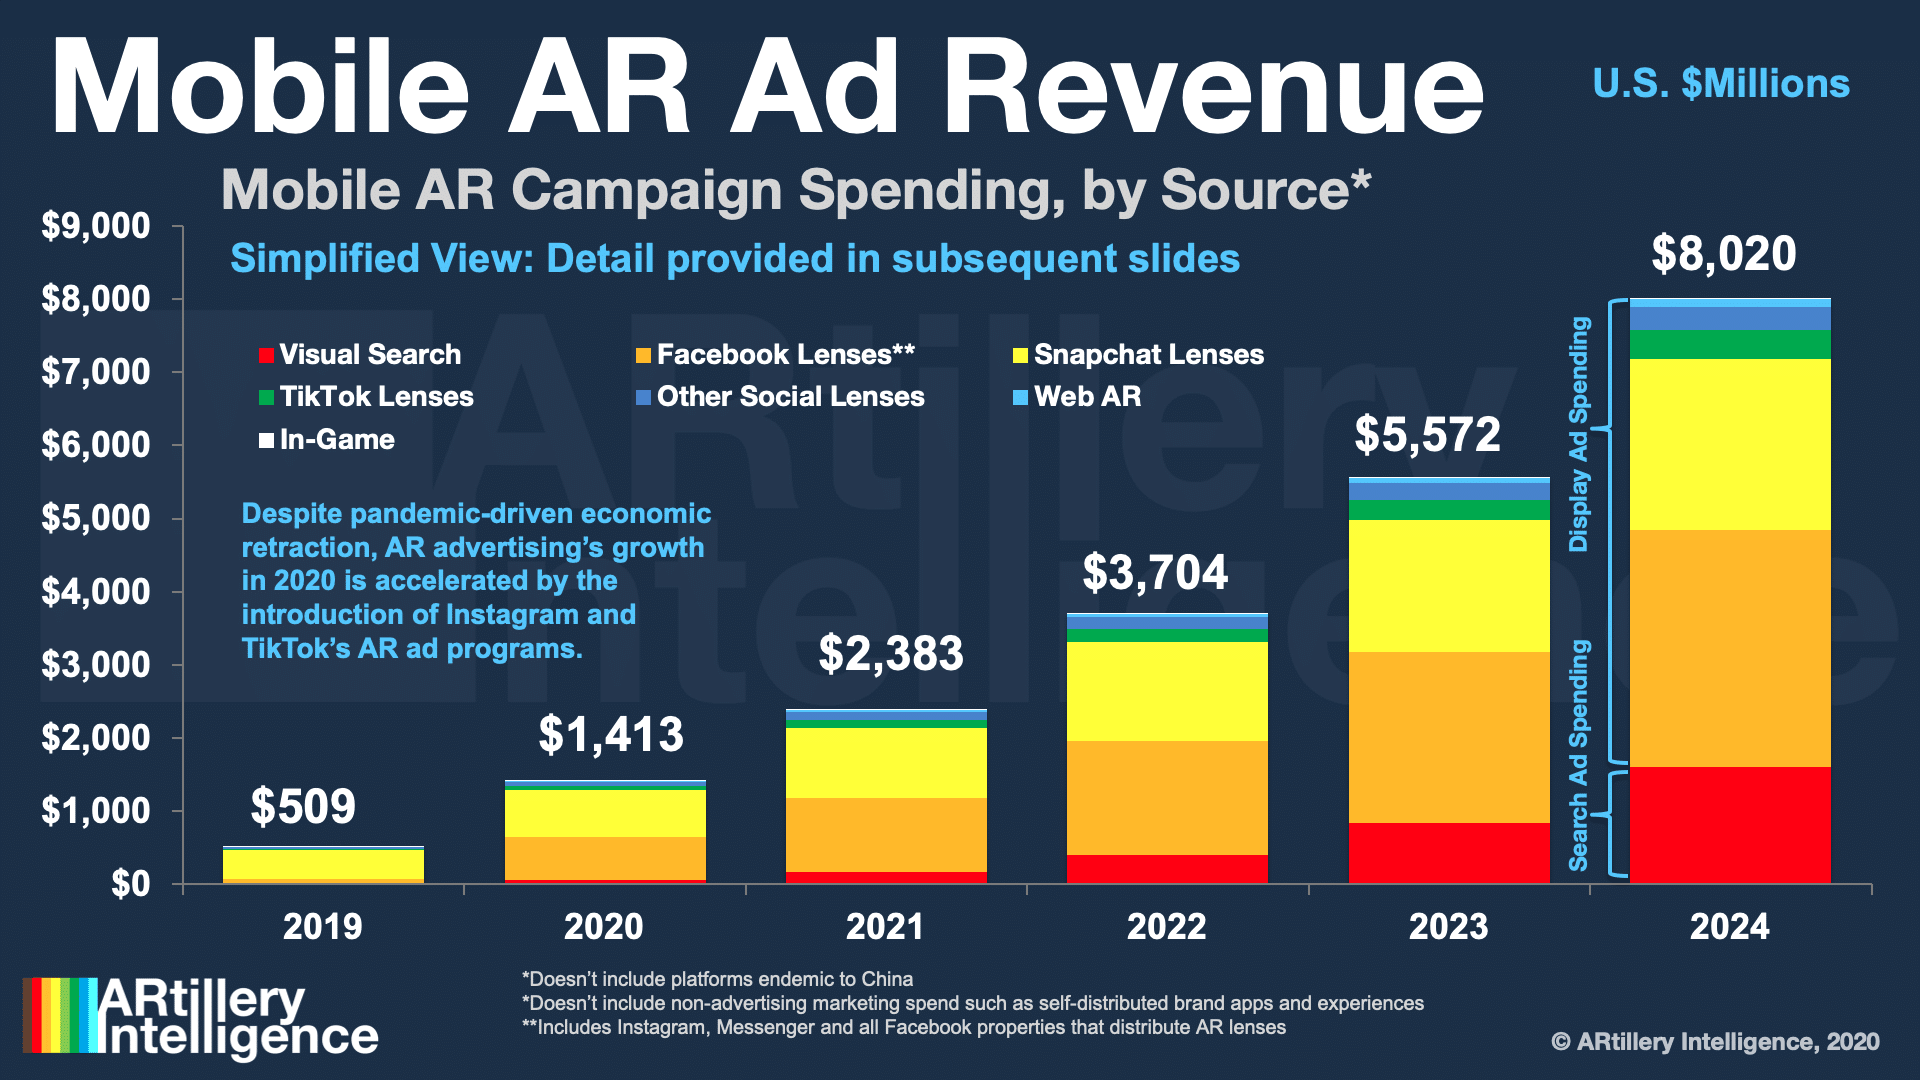
Advertising is one of the most lucrative AR subsectors, on pace to reach $1.41 billion this year and $8.02 billion by 2024. These figures measure the money spent on sponsored AR experiences with paid distribution on networks like Facebook and Snapchat.
As we’ve examined in past reports, the factors propelling this revenue growth include brand advertisers’ growing affinity for AR. Its ability to demonstrate products in immersive ways resonates with their creative sensibilities, transcending what’s possible in 2D formats.
Beyond that high-level appeal, there’s a real business case. AR ad campaigns continue to show strong performance metrics. This was the case in “normal” times and has accelerated during the COVID era, when retail lockdowns compel AR’s ability to visualize products remotely.
Standard Units
Picking up where we left off last week in examining AR advertising definitions and drivers, another factor to acknowledge is analytics. What are the right metrics for AR engagement? The advertising world tends to stick to what it knows, such as impressions and click-through rates (CTRs).
But AR engagement may not be adequately measured in these ways. Besides being created for a different medium (desktop ad exposure), things like impressions and CTRs don’t capture AR’s depth of experience. Its immersion can do things like boost memory recall and “craveability.”
Of course, the ultimate metric is revenue. It’s a universally-understood metric that applies across ad formats. But its direct tie to ad performance isn’t always available. When revenue lift can be tracked – usually with lower-funnel formats – attributing campaign success is straightforward.
But because that’s not always the case, the advertising world generally relies on metrics that are proxies for, or extrapolations of, revenue impact. This has led to digital advertising benchmarks such as impressions, clicks and other metrics that may map to campaign goals.
So AR’s challenge will be to develop native metrics: We still don’t know what they’ll be. What will be the CTR of AR? We’re starting to see some early indicators emerge, many of which are demonstrated in the case studies in Part II of this report. But these metrics are still developing.

Longer and More Often
One example of native AR metrics that are developing is dwell time. How long did users spend with a given experience? AR’s ability to captivate consumers with immersive content has proved to boost this metric, which can in turn boost things like brand affinity and ad recall.
For example, 8th Wall reports that 80 percent of users of its AR activations had session lengths greater than one minute; and 50 percent were greater than two minutes. Poplar’s David Ripert likewise reports 75-second average dwell times for AR lenses — 4x longer than mobile video.
Beyond session lengths, there’s also frequency, which shows strong early signs. For example, Snapchat reports that its lens users engage 30 times per-day. This includes organic (non-advertising) lenses but it still signals engagement levels that sponsored lenses are capable of.
All of the above will be important to establish benchmarks. Standard units like session lengths can assign value to engagement levels advertisers can expect. Because advertisers’ biggest aversion to AR is unclarity of ROI, standard metrics can help “normalize” its performance.
“With media agencies and creative agencies, it’s hard to reframe your mind in this new medium,” M7 Innovations’ Matt Maher told us. “So you benchmark it based on the past medium. […] But slowly, we’re seeing the smart marketers say, ‘Okay, we’ll create new benchmarks. We’ll start to adapt what we know.’ You don’t want this to be a bolted-on innovation. If it’s measured wrong [the client is] never going to do AR again. So you kind of need that balance of both to justify the spend.”
We’ll pause there and circle back next week with more. Meanwhile, to demonstrate AR campaigns that are starting to apply these evolving metrics, our research arm ARtillery Intelligence recently published a report on AR advertising case studies. Check it out here.