

VR’s momentum continues to build. Covid-inflicted supply-chain impediments caused shipments to decline an estimated 10 percent in 2020, but that could have been worse if not for Quest 2’s Q4 performance. We’ve also seen a strong overall start for VR in 2021.
We continue to compile evidence to that effect. But going one level deeper, what market signals can serve as formula inputs to estimate Quest 2 sales specifically? As the current propellant for VR’s gradual mainstream penetration, Quest 2 sales can reveal key market insights.
So it’s time once again for our quarterly exercise to extrapolate unit sales. Each time we do this, formula inputs vary — everything from Facebook first-party software sales disclosures to public filings that help reveal sales volume and growth within Facebook’s “other revenue” category.
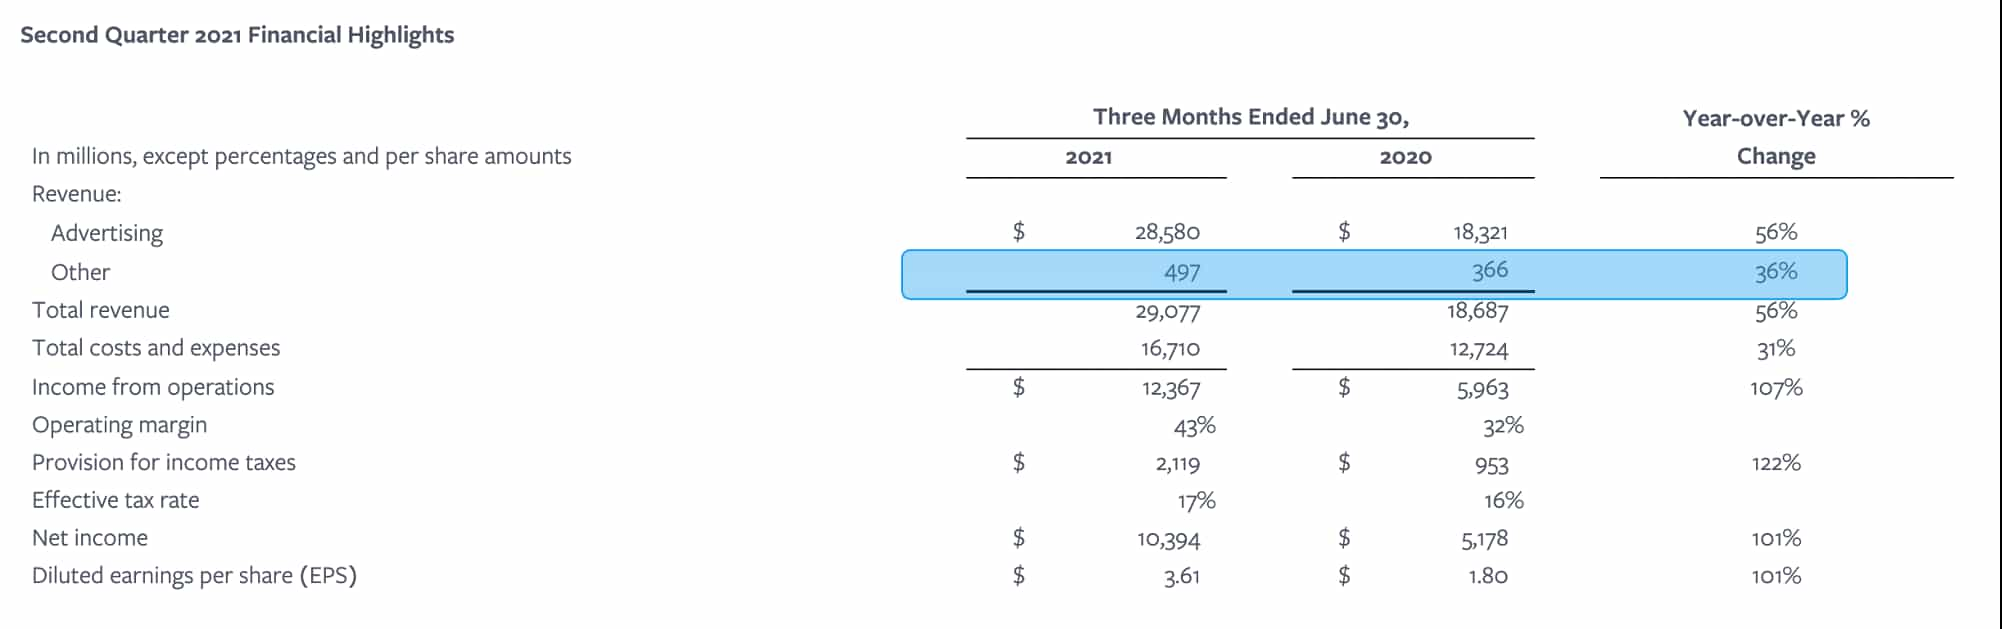
Today, we’re drawing upon the latter — the primary source being Facebook’s Q2 earnings that show non-advertising revenue growth of 36 percent year-over-year to $497 million. This is a sequential quarterly decline (more on that in a bit) but can help us triangulate Quest 2 sales.
With that scene-setting, let’s dive in.
Data Dive: How Many Quest 2s Sold in Q1?
Six Figures
Facebook’s Q2 non-advertising revenue — where Oculus revenues are categorized — was $497 million as noted. The company has stated publicly that Oculus is the growth engine for this revenue center. That’s of course a general statement but we can zero in using other signals.
If we look at Facebook’s non-advertising revenues pre-Oculus, it was a slow-growth quarterly revenue stream of about $250 million. If we estimate the non-Oculus portion today — consisting of Portal and few other things — to be $275 million, that leaves $222 million for Oculus.
By “Oculus,” we mean hardware and software. If we extract the latter, we can isolate the former. We’ve separately estimated average software spend per user to be $125 (3-7 games). That’s about 28 percent of Oculus’s overall ARPU ($454), given $299-$399 hardware.*
That makes hardware revenue $160 million of the above $222 million. Based on other evidence, we estimate that Quest 2 is 95 percent of that — the rest being relatively low-value accessories. That yields $152 million, or 461,544 Quest 2 units, at an average price of $329.**
This of course is an extrapolation and a thought excercise, but it gets us some sense of volume. Feel free to play with the formula to test different outcomes.
((($497,000,000 – $275,000,000)(1-.28)(.95)) / $329) = 461,544 Q2 Quest 2 units
*This figure represents the Oculus Store’s gross revenue, before developer payouts, which are usually 70 percent after taxes.
**Quest 2 base model (64GB) is $299 while the 256GB model is $399. This averages out at $349, but we’ve reduced the estimated hardware ARPU to $329 due to weighted sales for the base model (common for new hardware). Third-party reseller markups aren’t included.
Apples-to-Apples
Back to an earlier point, non-advertising revenue declined on a sequential-quarterly basis, despite 36 percent year-over-year growth. This is why you often hear revenue growth framed in year-over-year terms, as it’s more apples-to-apples in terms of seasonal variables.
But the quarter-over-quarter decline can’t be ignored. We saw the same thing from Q4 to Q1, explained by Q4’s standard holiday surge. The Q2 decline is conversely due to Covid’s correlation to gaming sales — for better and worse — and global chip shortages that impact GPU supply.
As for cumulative Quest 1 & 2 sales (a.k.a. installed base), we now estimate that at 3.3 million units. This figure factors in our ongoing tracking through excercises like the above, and the work of our research arm, ARtillery Intelligence. It also aligns with market clues seen elsewhere.
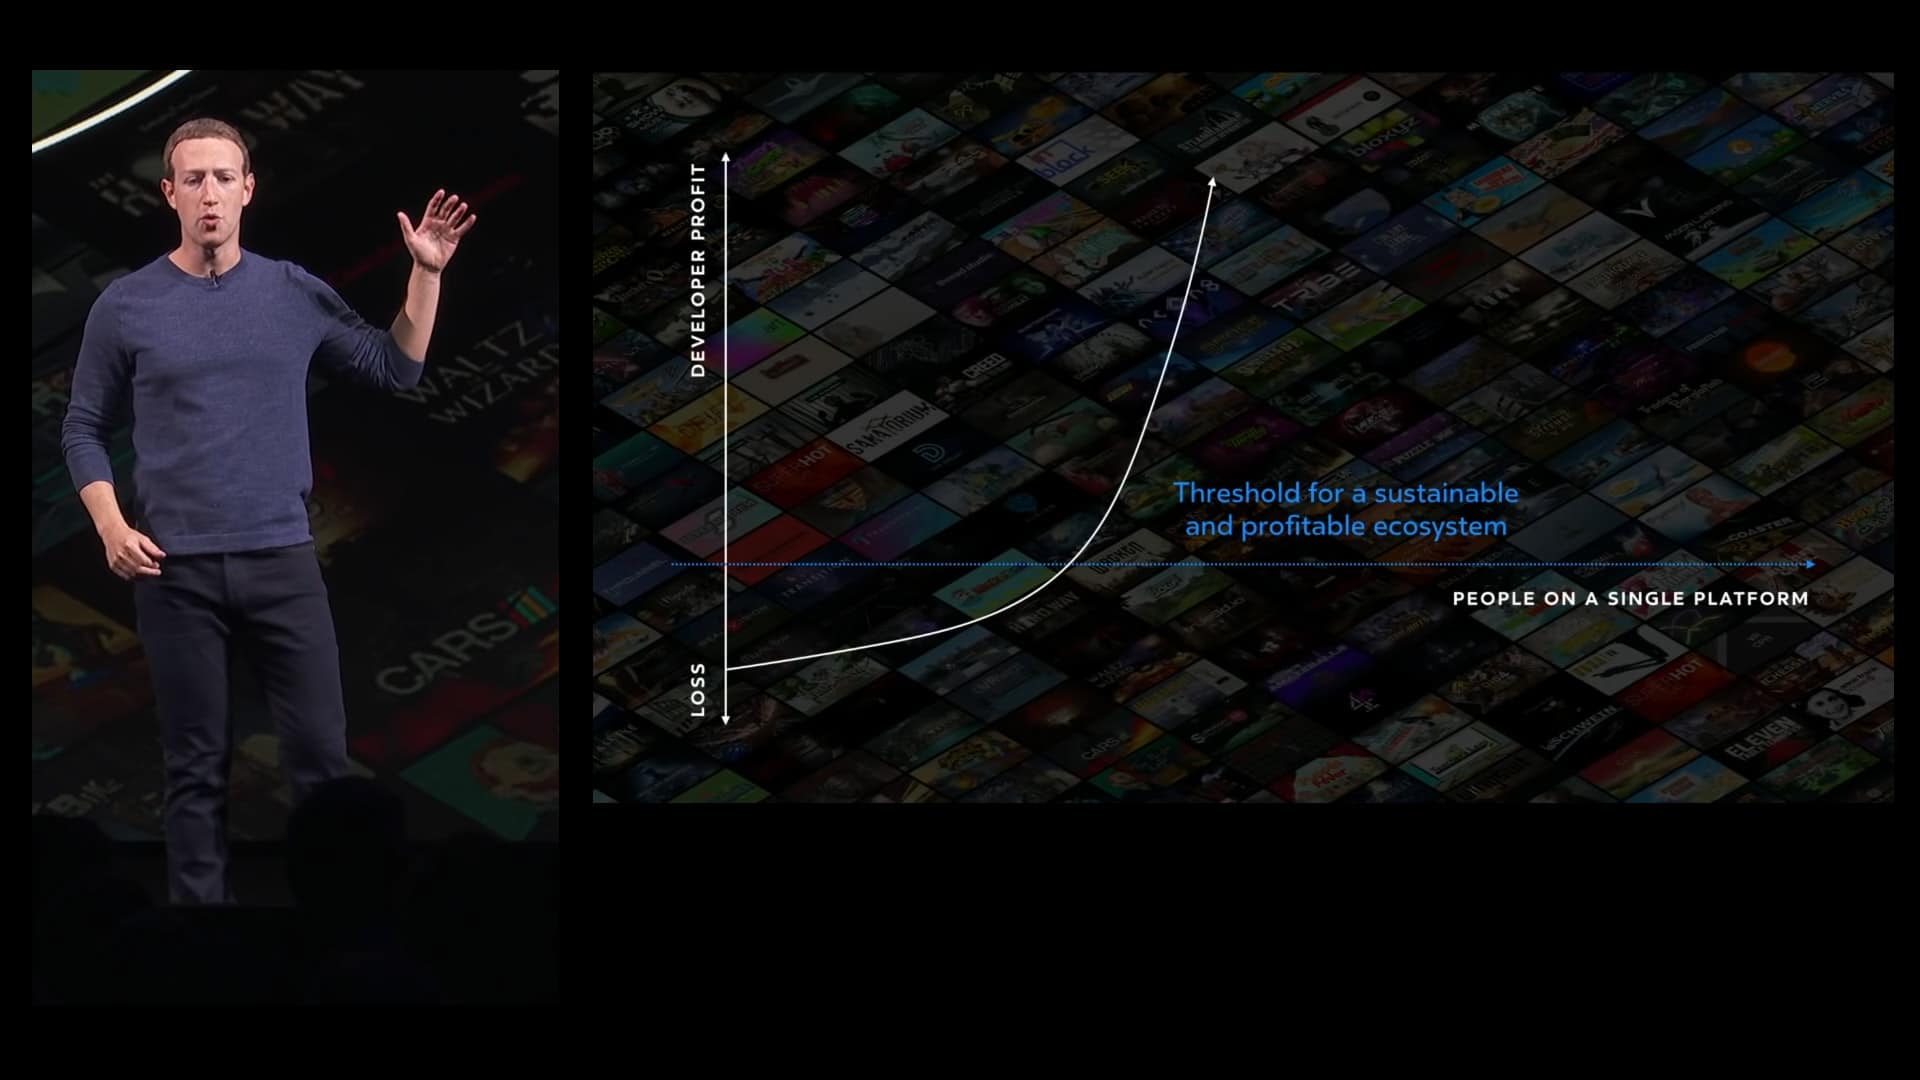
Panning back, this gets Facebook closer to Mark Zuckerberg’s target of 10 million units — the magic number where there’s critical mass to attract content developers en masse. The thought is that an eight-figure installed base presents financial incentive for developers.
As those developers flock to a given platform like osmosis, it results in greater content libraries that attract more users, which in turn attract more developers and around we go. It’s a classic flywheel effect. Or as Mark Zuckerberg has stated publicly:
”The big question is what is it going to take for it to be profitable for all developers to build these large efforts for VR? To get to that level, we think that we need about 10 million people on a given platform. That’s the threshold where the number of people using and buying VR content makes it sustainable and profitable for all kinds of developers. And once we get across this threshold, we think that the content and the ecosystem are just going to explode. Importantly, this threshold isn’t 10 million people across all different types of VR. Because if you build a game for Rift, it doesn’t necessarily work on Go or PlayStation VR. So we need 10 million people on [one] platform.”
2-Year Plan
If we pan back to Quest 2’s average sales and momentum, it’s on pace for 10 million units in about 8 quarters or 2 years. Keep in mind that 10 million references a cumulative installed base of in-market units, which is different than (and builds faster than) period unit sales.
We’ll keep watching closely as this progresses. Though Facebook doesn’t disclose hardware sales, there are clues and formula inputs all around us for thought exercises like above. It’s also possible that Quest 2 sales reach a point soon that compels Facebook to boast exact figures.