
 Data Dive is AR Insider’s weekly dive into select spatial computing figures. Running Mondays, it includes data points and strategic takeaways. For an indexed library of data, reports, and multimedia, subscribe to ARtillery Pro.
To commemorate Oculus Quest 2’s unveiling last week, we return to our periodic thought exercise to estimate the device’s unit sales. Here, we’re obviously looking at Quest 1 sales given that Quest 2 units don’t start shipping to the public until mid-next month.
Like in past exercises, the methodology here is to use content revenue disclosures to extrapolate device sales. Given variables like average game prices and games-per-user, we can use content revenue to estimate device sales. It’s using known quantities to triangulate unknown ones.
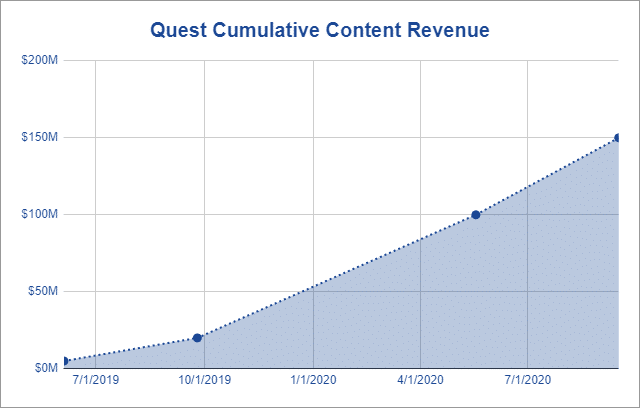
The timing is right for this exercise because content sales are precisely what we were given this week. Facebook announced it has exceeded $150 million in Quest content to date. This follows its announced $100 million in May when we last did this exercise, and $20 million last Fall.
Before diving in, we’ll give the standard disclaimer that the results of this exercise aren’t figures from Facebook, nor official projections from our research arm ARtillery Intelligence. As a thought exercise, it’s about getting a better sense of market levels (which informs ARtillery projections).
Breaking the Million-Unit Barrier
Jumping right in, there’s evidence that the average Quest game price is $25. This is the formula input we’ve used in past exercises. As for games per-user, we’ve estimated 3 in early exercises and 5 in our May calculation. This figure naturally grows over time as game/app libraries expand.
Factoring that growth — along with a natural ceiling that causes game libraries to decelerate/ plateau over time; plus recessionary consumer spending — we can apply 6 games per user for the sake of this exercise. This puts the average software/games spend per headset at $150.
Using that figure and bringing back the $150 million in cumulative content revenue, we get an even one-million units. Or, feel free to use the formula below to plug in variables and test other scenarios. We’re confident in these inputs — but this is, again, a thought exercise so plug away.
($150,000,000/(6*$25) = 1,000,000 units sold to date.
Now let’s take it a step further. If we want to estimate 2020 Quest unit sales, we can use the above number and subtract our previous calculations of 425,000 Quest units sold in 2019. Using that approach, we end up with an estimated 575,000 units for 2020.
1,000,000 – 425,000 = 575,000 units sold in 2020

COVID Impact?
The 2020 calculation above is important to get a sense of the impact from COVID-era supply-chain impediments. Anecdotally (frequent inventory checks), these factors have impacted Quest availability since March. Yes, it was sold out pre-COVID, but that was due to excessive demand.
To get a true sense of COVID’s impact, we have to isolate 2020’s COVID-inflicted months. Moreover, we need a year-over-year (YoY) comparison. Due to growth and cyclical factors (think: holidays) within a given calendar year, YoY comparisons allow us to isolate the right variables.
In that spirit of YoY analysis, we can go back to our 333,000 unit estimate for May (Quest launch) through mid-September 2019. The same COVID-inflicted period in 2020 indicates 200,000 units if we compare the above one-million lifetime sales with our 800,000 calculation in late May.
So if we believe this YoY sales dip, the remaining question is what COVID-era factors caused it. It’s a likely combination of supply and demand, meaning manufacturing impediments and recessionary spending — likely more of the former, given gaming’s “COVID-advantaged” status.
Here we’ll give the disclaimer that these YoY comparisons invoke the outputs of our previous estimates and extrapolations. But given a consistent methodology over time, it’s directionally relevant in terms of longitudinal analyses. We’ll keep watching closely for more clues.