
Data Point of the Week is AR Insider’s dive into the latest spatial computing figures. It includes data points, along with narrative insights and takeaways. For an indexed collection of data and reports, subscribe to ARtillery Pro.
One of the ongoing challenges in market sizing is to piece together clues to extrapolate things like unit sales and revenues. In mature markets like smartphones, hardware players disclose figures — especially if public — but it’s a lot quieter on the early-stage front.
That’s the case with VR, which becomes an exercise in gathering hints in perpetual market-sizing mode. Sometimes there are gifts like Sony’s frequent disclosures while boasting PSVR sales. Otherwise, it’s about detective work and talking to as many industry insiders as possible.
But there are also some valuable gut checks and thought exercises along the way. For example, our September estimates for 333,000 cumulative Oculus Quests sales were based on disclosures at the OC6 conference that $20 million in games had been sold for the device.
More recently, we performed a similar thought exercise for Quest holiday sales, based on the $5 million in Christmas day game purchases that Facebook announced. Now we embark on another thought exercise for Quest sales by going straight to the source: Facebook 10K filings.
Straight to the Source
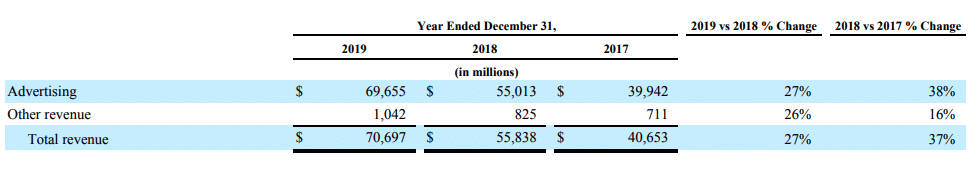
As background, Facebook reports Oculus revenues under the “Payments and Other Fees” revenue category in its public filings. This includes other revenue sources, so estimating Oculus revenues — or revenues attributable to any one headset — is challenging but doable.
Facebook’s 2019 Payment and Other Fes were $1.042 billion. To estimate Quest’s revenue share, we can look at the delta over 2018, given the device’s mid-2019 launch. This would assume flat growth in other revenue categories like payments, Rift and Go, which we’ll do for now.
Given 2018 Payment and Other Fees of $825 million, the delta is $217 million. This is the upper limit that we can estimate for Oculus Quest revenues, again with the assumption (for the sake of this exercise) that other revenue sources within Payment and Other Fees were flat in 2019.
The next question is Quest unit sales. Subtracting Quest content revenues of $35 million (more on that in a bit), we end up with $182 million. Given $429 average revenue per unit*, this would mean 2019 unit sales of 424,242. This is again an estimate, given the above assumptions.
((($1,042,000,000-$825,000,000)-$35,000,000)/$429) = 424,242
Sales Runway
Figures can also be tweaked further using the formula provided above. For example, let’s say that Rift and Go sales grew in 2019. That would reduce the $217 million attributed to Quest. As mentioned, the above calculations assume flat sales (hardware and software) for Rift and Go.
We think this is a reasonable assumption for the purposes of this exercise. It’s likely that Go sales grew in full-year 2019, given only 8 months of sales runway ’18. However, Quest itself likely cannibalized ’19 Go sales to some degree, with any remaining gains offset by declines for Rift S.
As for the $35 million in Quest content sales, Facebook announced $20 million at OC6 in late September — four months after Quest’s May 21 launch. That run rate of $5 million per month annualizes at $35 million (7 months), given sustained sales through launch and holiday surges.
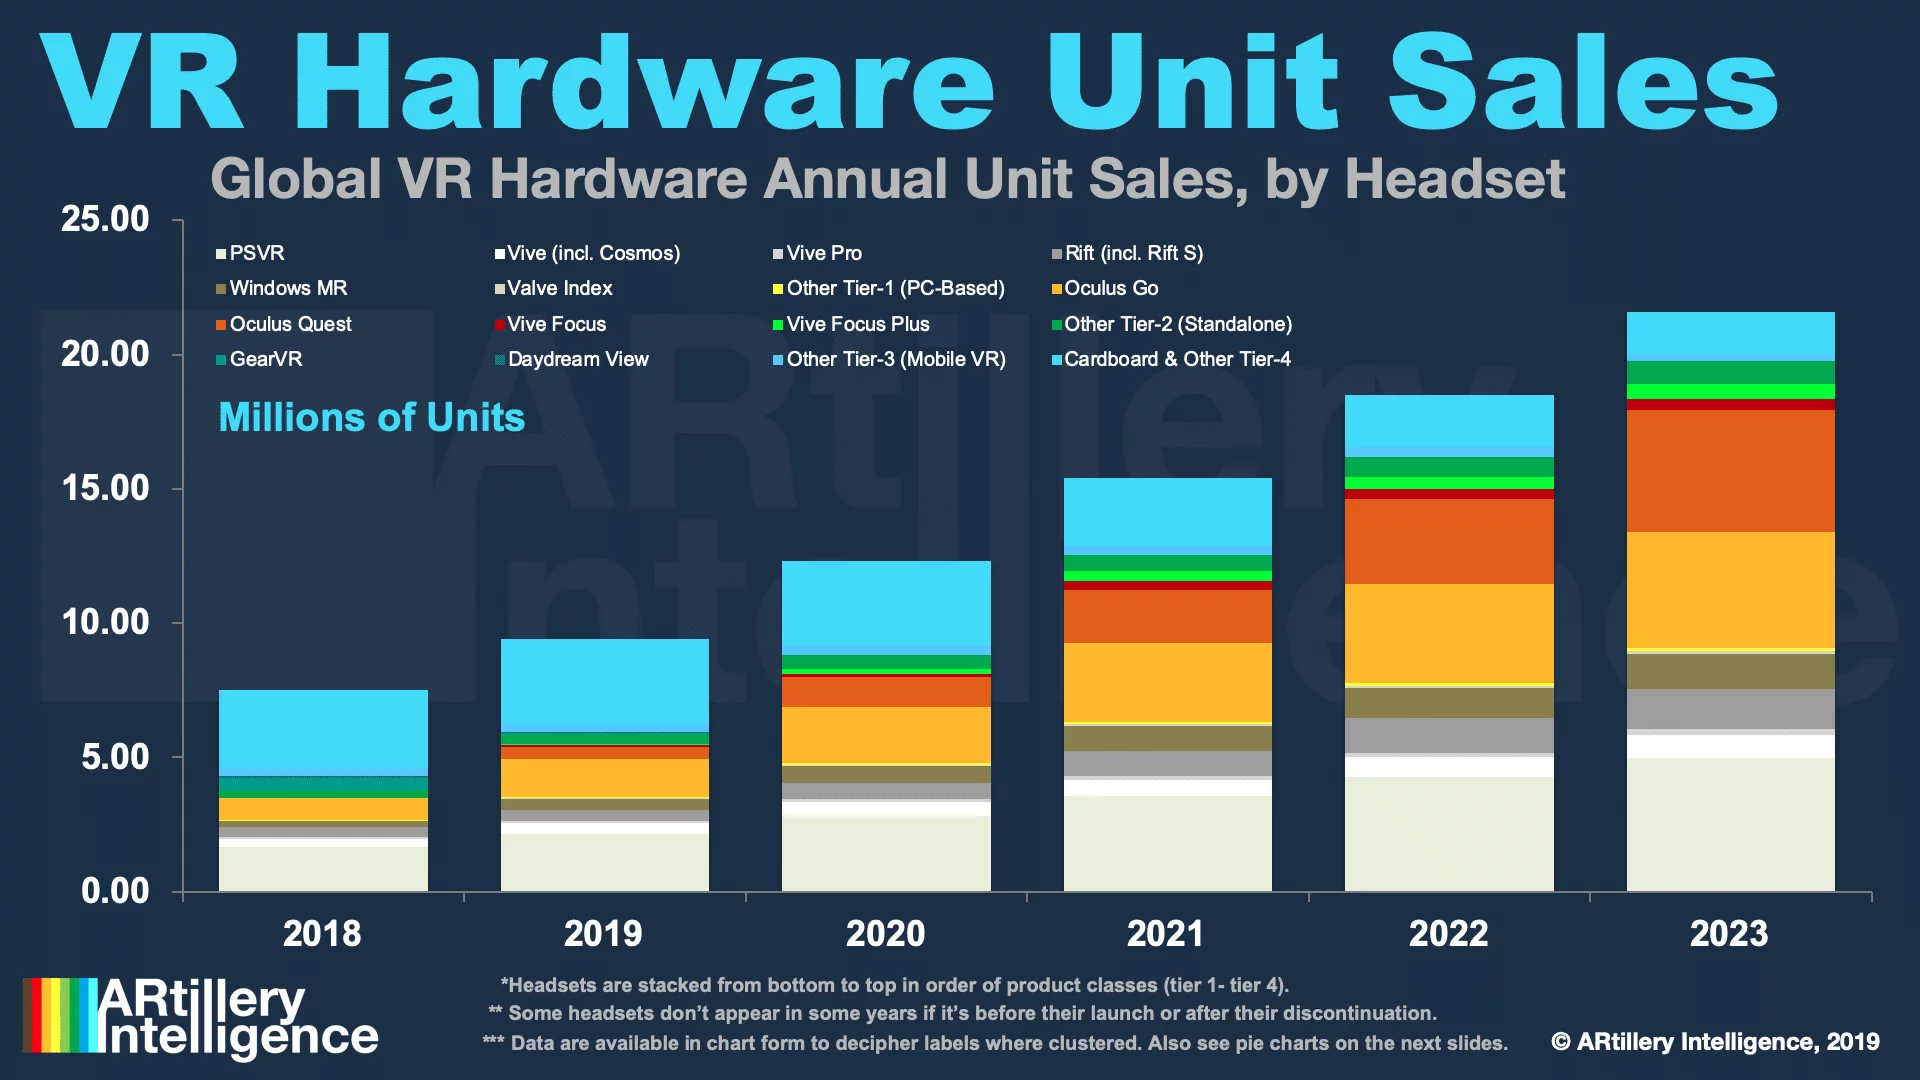
Lastly, if 424,242 units is accurate, the projections made earlier in 2019 by our research arm, ARtillery Intelligence are close. Its Global Revenue Forecast projected 2019 Quest sales to reach 470,000 units. This projection was based on earlier thought exercises just like the above.
Thought Excercise
We’ll qualify all of the above that it’s just that: a thought exercise. It’s not an official Oculus figure, nor an official figure from AR Insider and its research arm ARtillery Intelligence. It’s about extrapolating ranges for a better sense of VR market levels, and to inform official figures to come.
Given the challenge of market sizing without first-party data from VR hardware providers (except Sony), it’s about constantly collecting clues like this, and building smart financial models. It’s like a Sudoku board: using known quantities to logically devise unknown ones.
We’ll continue our unhealthy obsession with assembling reliable inputs and reporting back what we find. Tracking these clues is important, not just to help buttress the market-sizing of our research arm, but to impart an ongoing sense of VR traction and its strategic implications.
*Oculus Quest base model (64GB) is $399 while the 128GM model is $499. This averages out at $449, but we’ve reduced Oculus’ ARPU to $429 due to weighted sales for the base model (common for new hardware) and affiliate revenue share with third-party sellers like Amazon.
For deeper XR data and intelligence, join ARtillery PRO and subscribe to the free AR Insider Weekly newsletter.
Disclosure: AR Insider has no financial stake in the companies mentioned in this post, nor received payment for its production. Disclosure and ethics policy can be seen here.