

This post is adapted from ARtillry’s latest Intelligence Briefing, Mobile AR Usage & Consumer Attitudes. It includes some of its data and takeaways, including original survey research. More can be previewed here and subscribe for the full report.
Usage: The “How Many?”
Starting our analysis at the very top, what’s the penetration and adoption of mobile AR among consumers? Our survey results indicate that it currently stands at about a third (32 percent). This isn’t surprising, but it’s slightly greater than expected when measured against anecdotal evidence.
This is a positive sign for the health of consumer-based mobile AR: These figures represent a combination of healthy adoption (considering the early stage) and lots of room to grow. We expect usage levels to accelerate quickly in future survey waves, similar to early smartphone adoption.

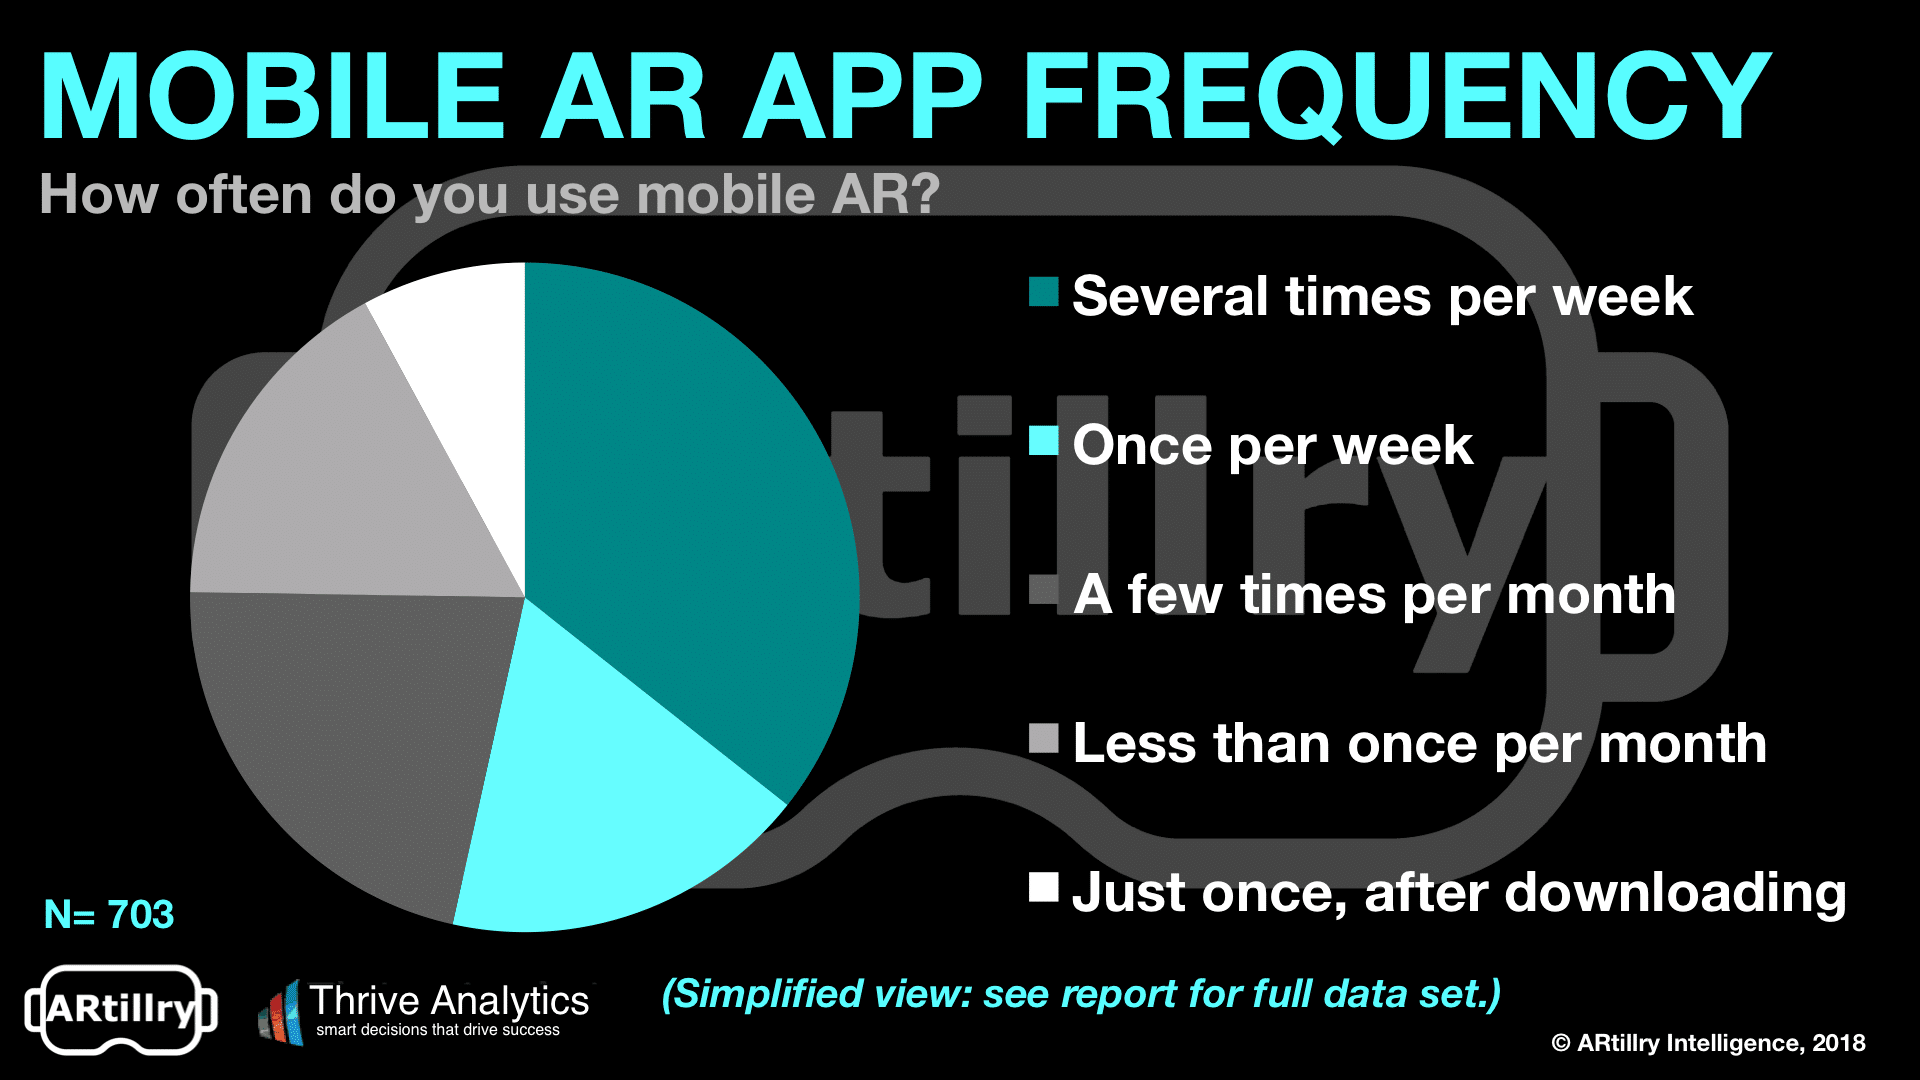
Frequency: The “How Often?”
The quantity of users alone is a binary figure. Either someone has used AR (at least once) or they haven’t. To provide more granularity, how often are they using AR? This gets to a key metric in mobile apps, which is to set aside download metrics and instead focus on active users.
The standard metric that has developed among analyst examinations and first-party reporting is monthly active users (MAU). On that measure, VRM survey data indicate that 66 percent of mobile AR users are active at least monthly. This is a relatively high figure by mobile app standards.
Going one level deeper, 54 percent of respondents use mobile AR at least once per week and 36 percent do so several times per week. Only 8 percent used AR just once, after initial download. This indicates that the active-use challenges endemic to mobile apps aren’t as great in AR.
This is surprising because mobile AR apps we’ve examined have appeal that lies mostly in novelty. AR is attractive for that reason, but the novelty can wear off quickly. As discussed in last month’s Intelligence Briefing, it’s advisable to combine novelty with sticky behavior.
For example, apps or features that fuse AR’s visual appeal with frequent or repeatable activities show the most monetization potential (e.g. in-app purchases). These “sticky” behaviors include social messaging, gaming, and commerce functions. These are things that happen daily or more.
Back to the active-use figures above, we can surmise that a lot of mobile AR adoption is with apps that inherently offer such frequent and habitual use. This stands to reason, given that the most popular mobile AR apps so far are in gaming and social messaging, which we’ll explore next.

For a deeper dive on AR & VR insights, see ARtillry’s new intelligence subscription, and sign up for the free ARtillry Weekly newsletter.
Disclosure: ARtillry has no financial stake in the companies mentioned in this post, nor received payment for its production. Disclosure and ethics policy can be seen here.