

This post is adapted from ARtillery Intelligence’s latest report, Mobile AR Usage & Consumer Attitudes. It includes some of its data and takeaways. More can be previewed here and subscribe for the full report.
How do consumers feel about mobile AR? Who’s using it? How often? And what do they want to see next? More importantly, what are non-users’ reasons for disinterest? And how can app developers and anyone else building mobile AR apps optimize product strategies accordingly?
These are the questions we set out to answer. Working closely with Thrive Analytics, ARtillery Intelligence wrote questions to be presented to more than 3000 U.S. adults. The results are in and analyzed in the latest ARtillery Intelligence report. Today we dive into users’ reported satisfaction.
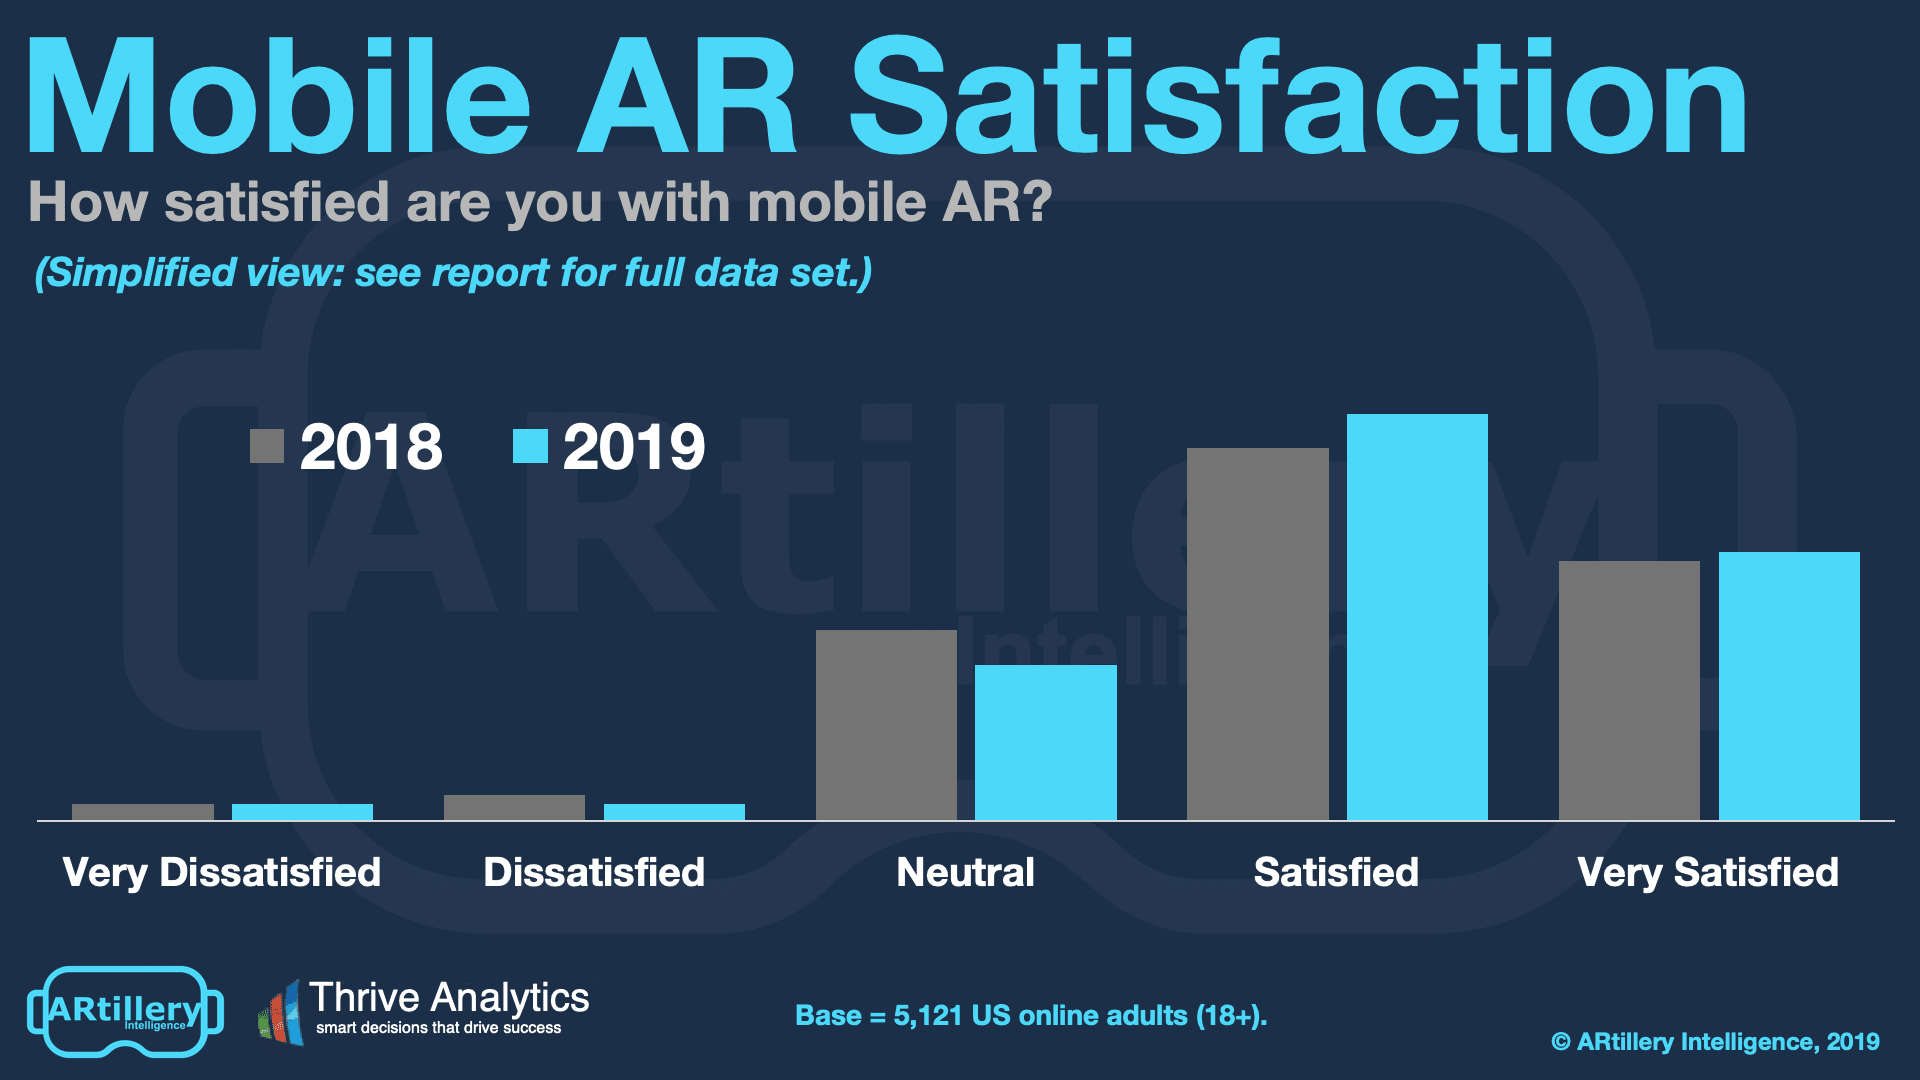
Satisfied?
Specifically, 78 percent report either high (47 percent) or very high (31 percent) satisfaction. 18 percent remain neutral and only four percent report low or very-low satisfaction. This is a good confidence signal for AR’s progress with consumers, and is mostly on track with last year’s data.
In fact there are few consumer products that show such high satisfaction levels. As a point of comparison, the counterpart VR findings that we examined in last July’s Intelligence Briefing were likewise high. But they were still slightly lower than these reported AR sentiments.
This tells us a few things. For one, AR’s highly visual and immersive format is already proving to captivate consumers. This is largely due to its revolutionary – rather than evolutionary – interface when compared with non-immersive mobile app experiences that have become routine.
It also counters some of the anecdotal observations we and others have made about the sub-par and underwhelming state of mobile AR experiences so far. We stand by the assertion that apps will evolve a great deal, just as early iOS apps did, but high satisfaction is happening already.
With two waves of survey research, consistent findings is another point of validation. With a larger collective sample and two waves of research, consistently-higher than expected satisfaction levels can’t be chalked up to anomaly. And future waves will provide additional longitudinal analysis.
Deeper Dive: Frequency + Satisfaction
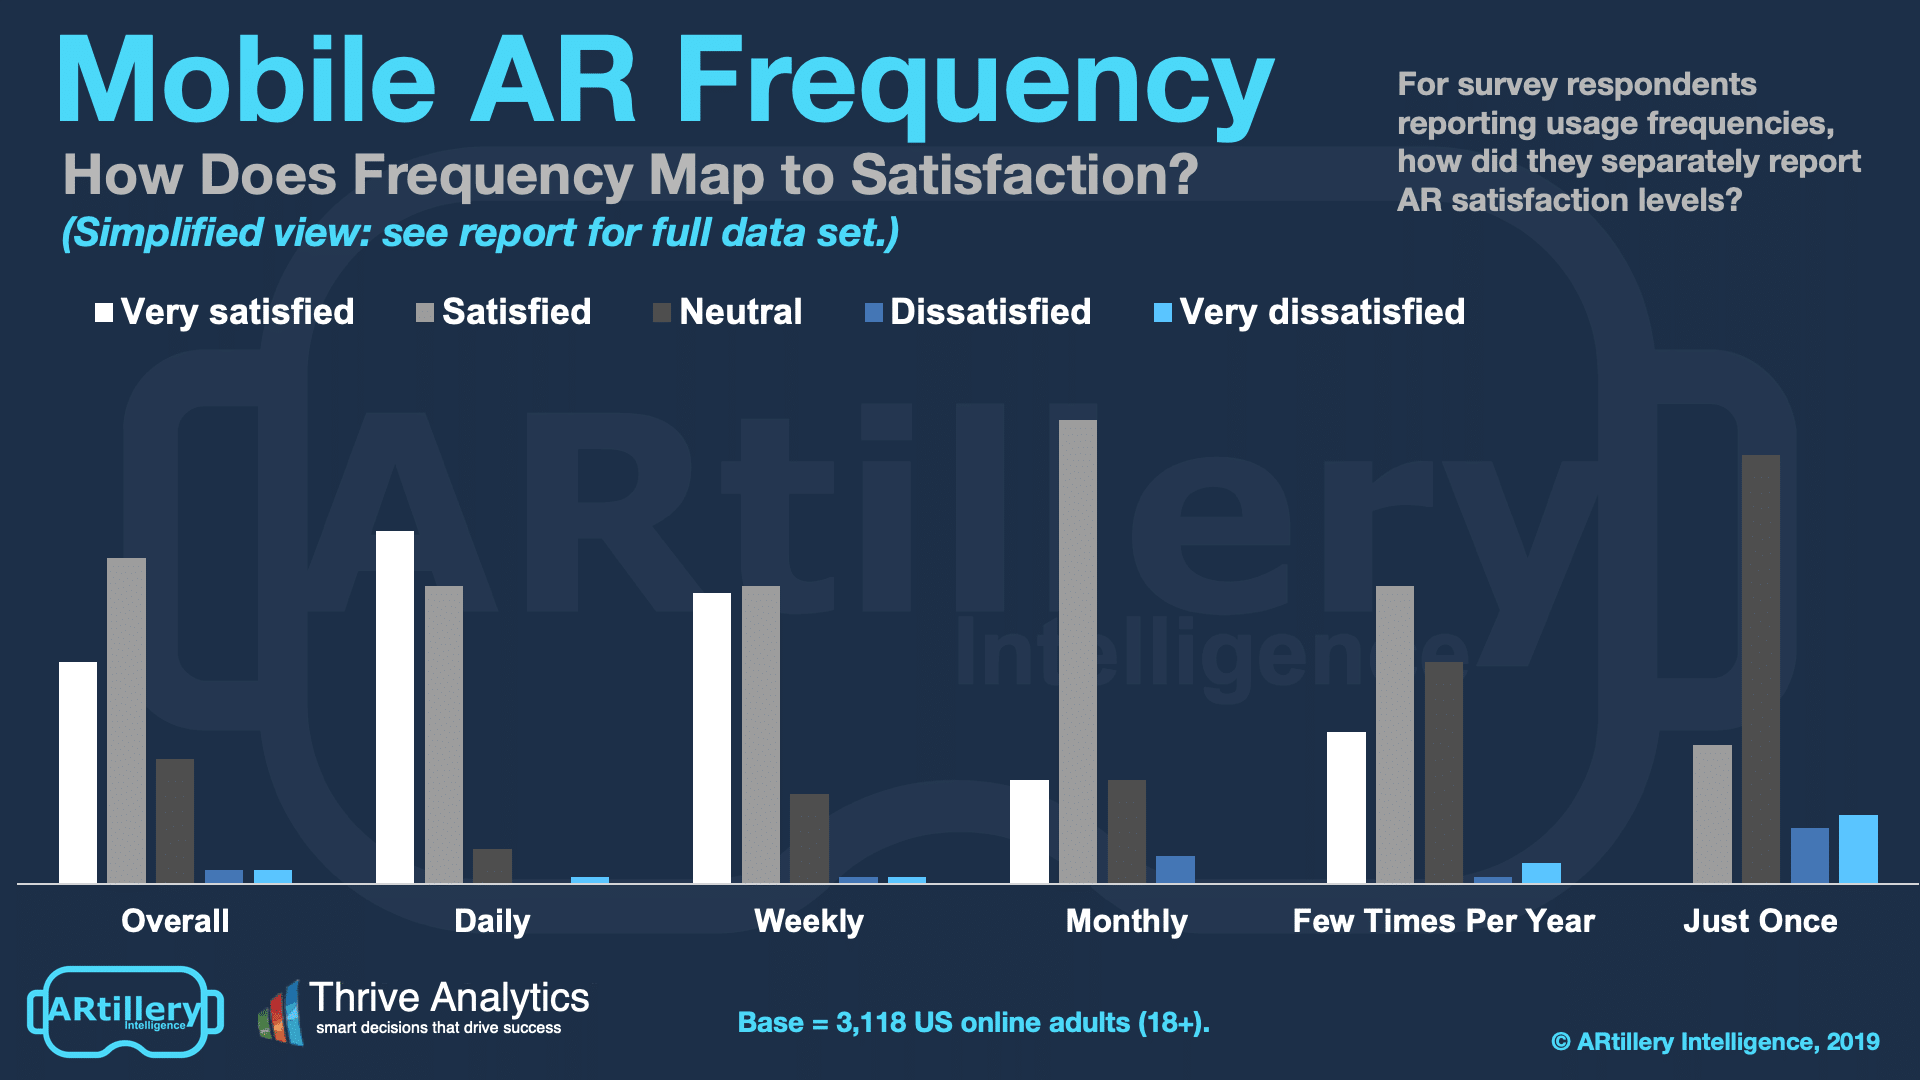
As we did last week, we’ll now cross-reference different sections of the survey data to gain additional insight. The question is, how do the above satisfaction ratings relate to the usage frequency that we examined last week? Or, how does AR usage frequency map to satisfaction?
To do this, we examined the range of reported usage frequencies, then referenced how those respondents separately reported AR satisfaction. The high-level takeaway is that the greatest satisfaction was with daily users, while moderate satisfaction was highest for monthly users.
This isn’t surprising, as frequency should map to satisfaction. Digging deeper, for “satisfied” users, monthly use (67%) exceeds daily and weekly use (43% each). But “very satisfied” users show the opposite, with much stronger daily (51%) and weekly (42%) than monthly (15%) use.
The takeaway is that there is a big jump in frequency that can be achieved by turning users from satisfied to very satisfied. That should be an obvious goal of any product, but the takeaway here is that there is an outsized payoff in usage frequency which directly impacts monetization potential.
Converting such users from satisfied to very satisfied will involve AR product and UX tactics that continue to develop. So far, they include some of the lessons in this report, such as adding social components (e.g. messaging), utility and gamification features to any given AR experience.
Cross Section
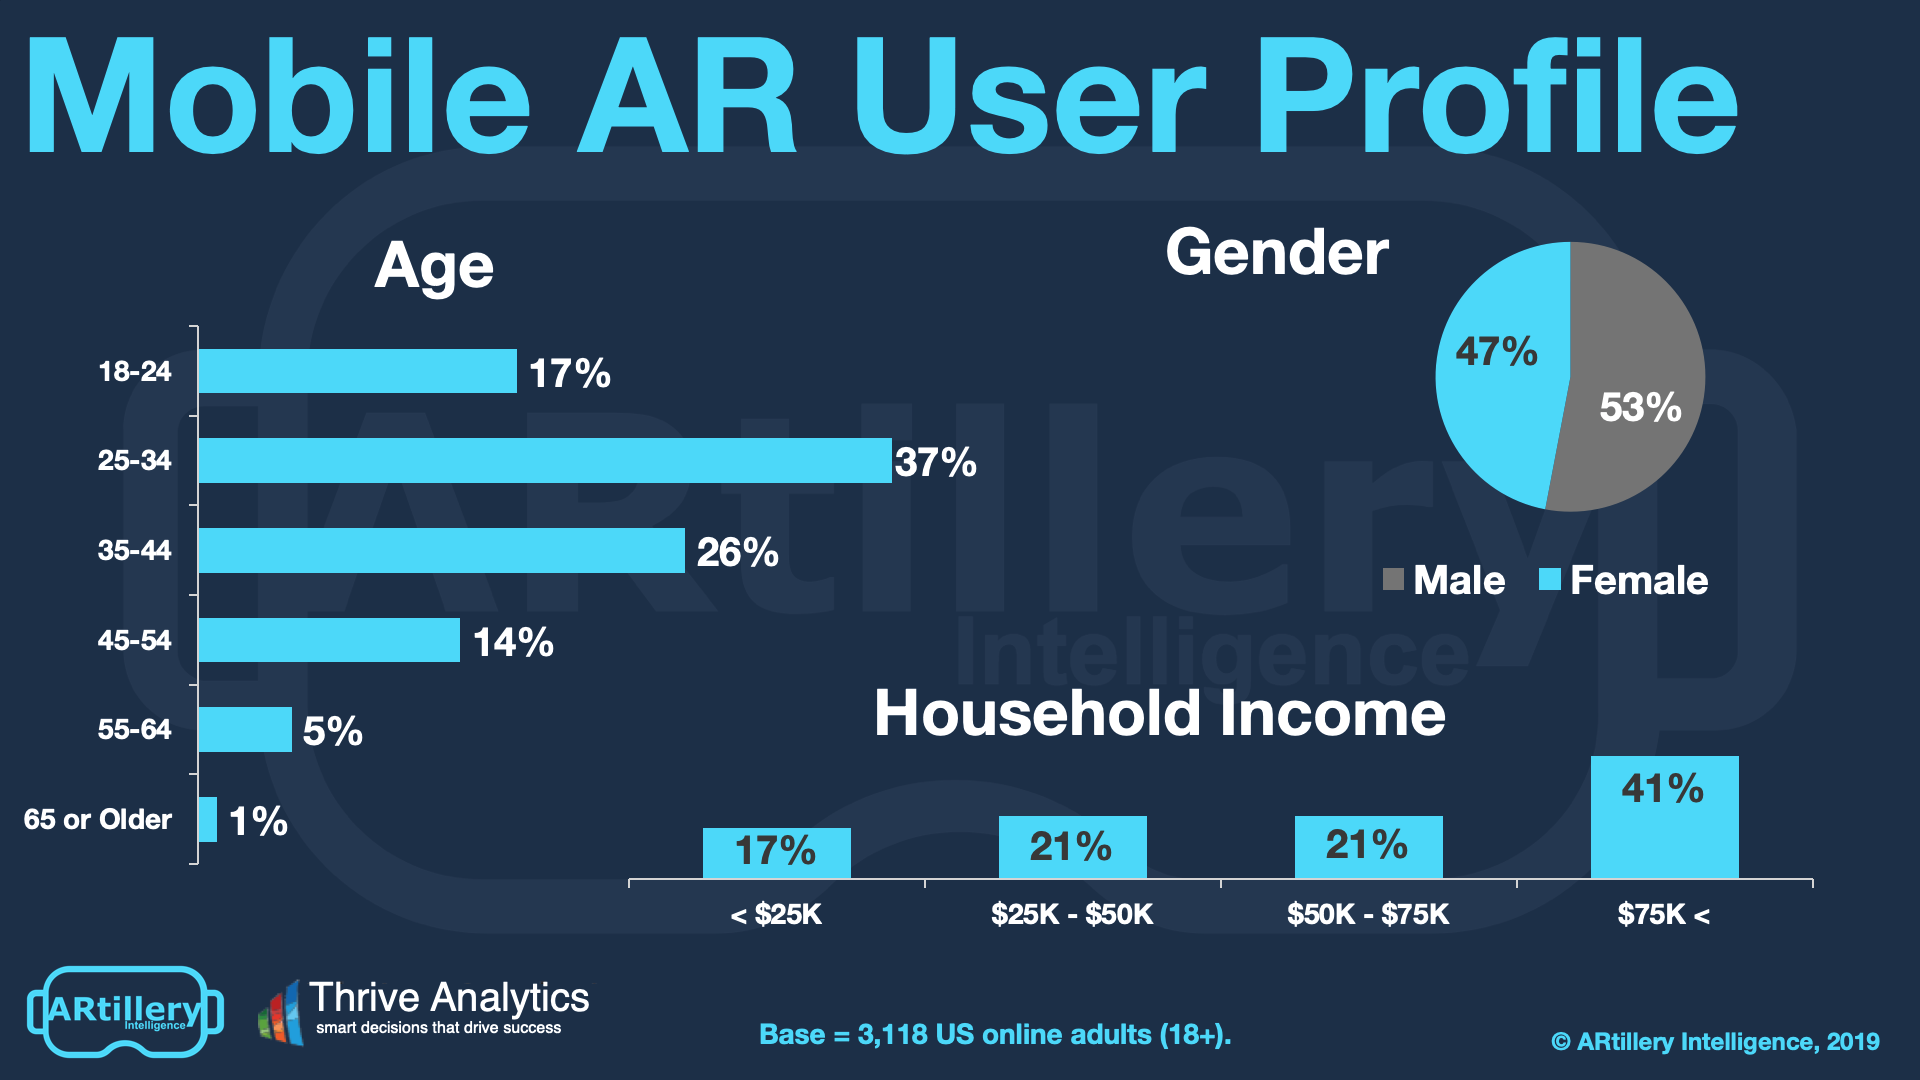
To add context to survey findings throughout this report, who’s answering the questions? It includes more than 3000 U.S. adults. Going deeper into demographics and psychographics, AR users break down as shown above.
As the data show, the segment of AR users spans a wide range of U.S. adult consumers. Gender breaks down fairly evenly, while age and income levels skew towards attractive demographic groups. That includes buying-empowered age groups (25-34), and high-income homes ($75K+).
See more details about this report or continue reading here.
For deeper XR data and intelligence, join ARtillery PRO and subscribe to the free AR Insider Weekly newsletter.
Disclosure: AR Insider has no financial stake in the companies mentioned in this post, nor received payment for its production. Disclosure and ethics policy can be seen here.