
This post is adapted from ARtillery Intelligence’s latest report, Mobile AR Usage & Consumer Attitudes. It includes some of its data and takeaways. More can be previewed here and subscribe for the full report.
How do consumers feel about mobile AR? Who’s using it? How often? And what do they want to see next? More importantly, what are non-users’ reasons for disinterest? And how can app developers and anyone else building mobile AR apps optimize product strategies accordingly?
These are the questions we set out to answer. Working closely with Thrive Analytics, ARtillery Intelligence wrote questions to be presented to more than 3000 U.S. adults. The results are in and analyzed in the latest ARtillery Intelligence report. Today we dive into usage frequency.
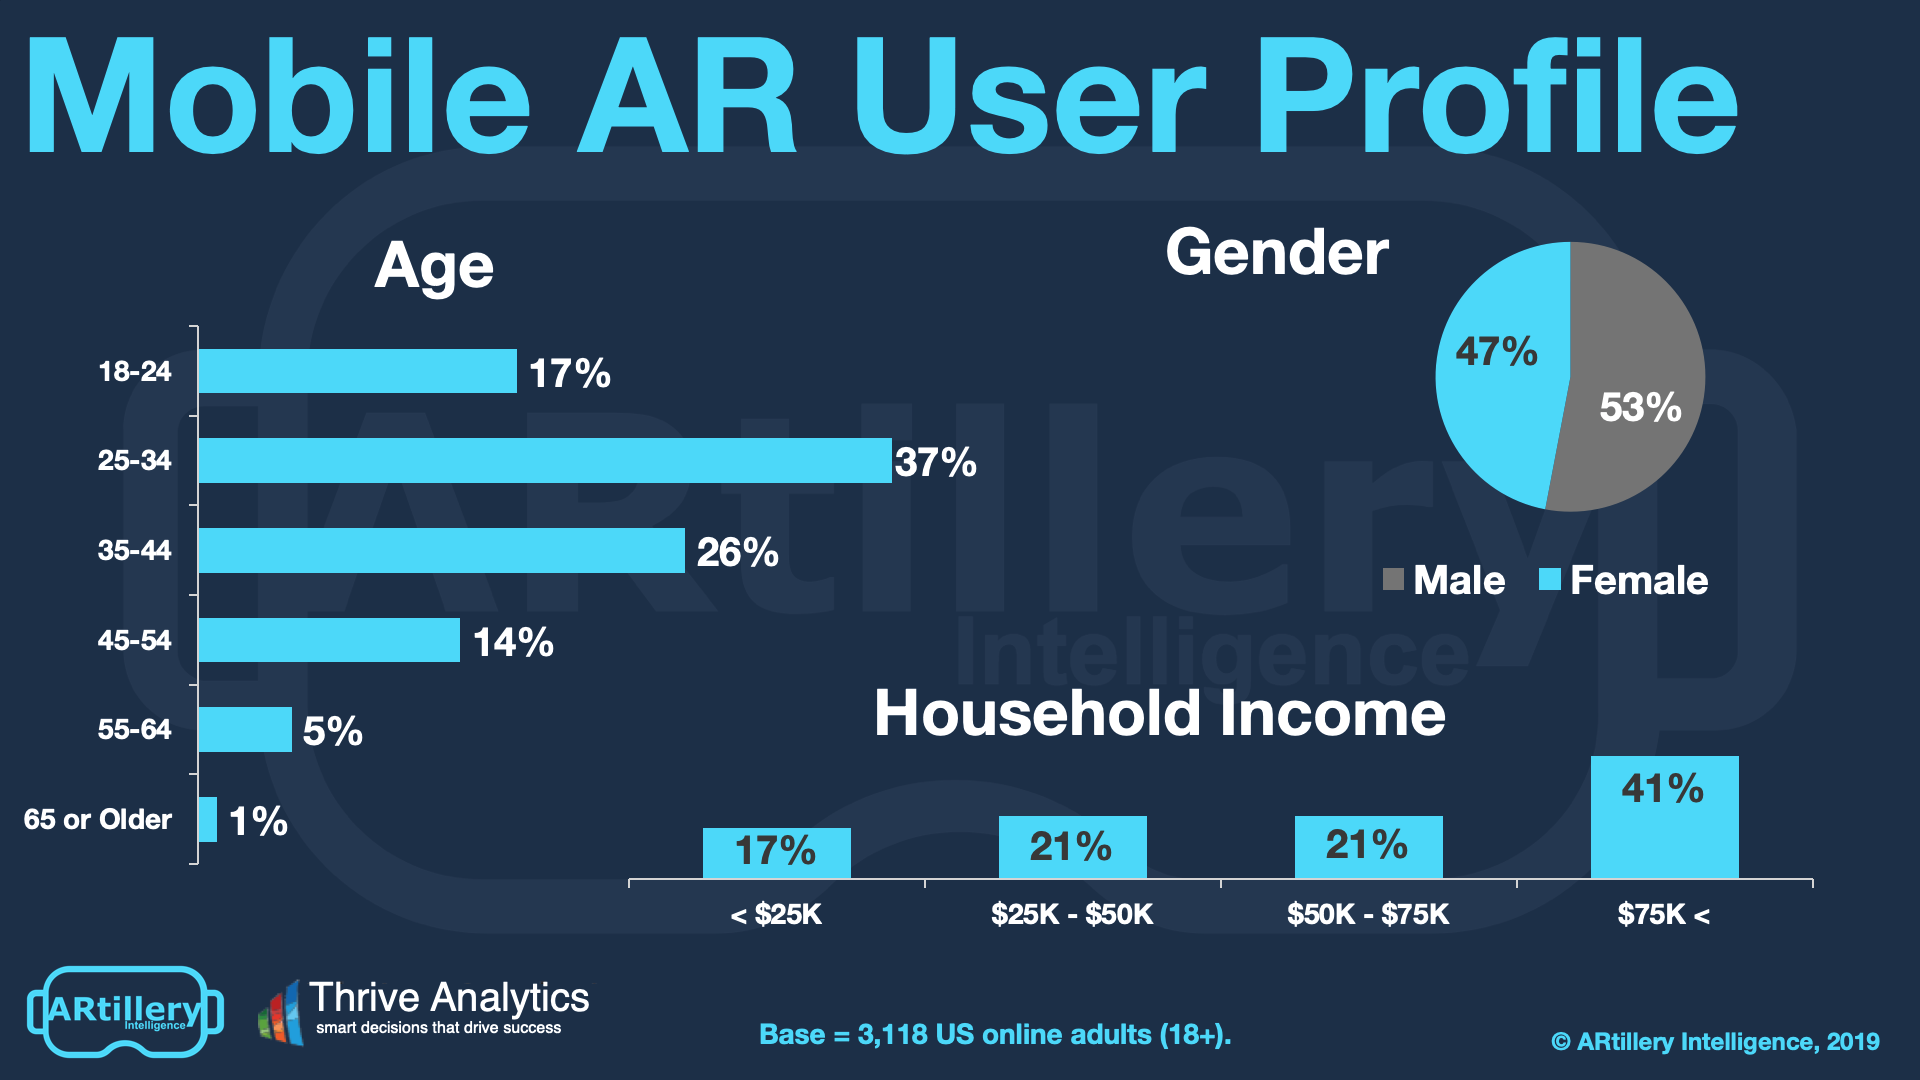
But to first add context to survey findings throughout this report, who’s answering the questions? It includes more than 3000 U.S. adults. Going deeper into demographics and psychographics, AR users break down as shown below. More detail and segmentation are available in the full report.
As the data show, the segment of AR users spans a wide range of U.S. adult consumers. Gender breaks down fairly evenly, while age and income levels skew towards attractive demographic groups. That includes buying-empowered age groups (25-34), and high-income homes ($75K+).
How Often?
Picking up where the last section left off, a key variable in tracking mobile AR success is how often it’s being used. As we’ve written, AR is a snack (VR is a meal). So shorter sessions should be counterbalanced by high-frequency. The name of the game is to instill active use or “replayability.”
Mobile AR experiences that fuse the novelty of augmentation with frequent or repeatable activities show the most monetization potential. These “sticky” behaviors include social messaging, gaming, and commerce-related functions. These are things that happen daily or more.
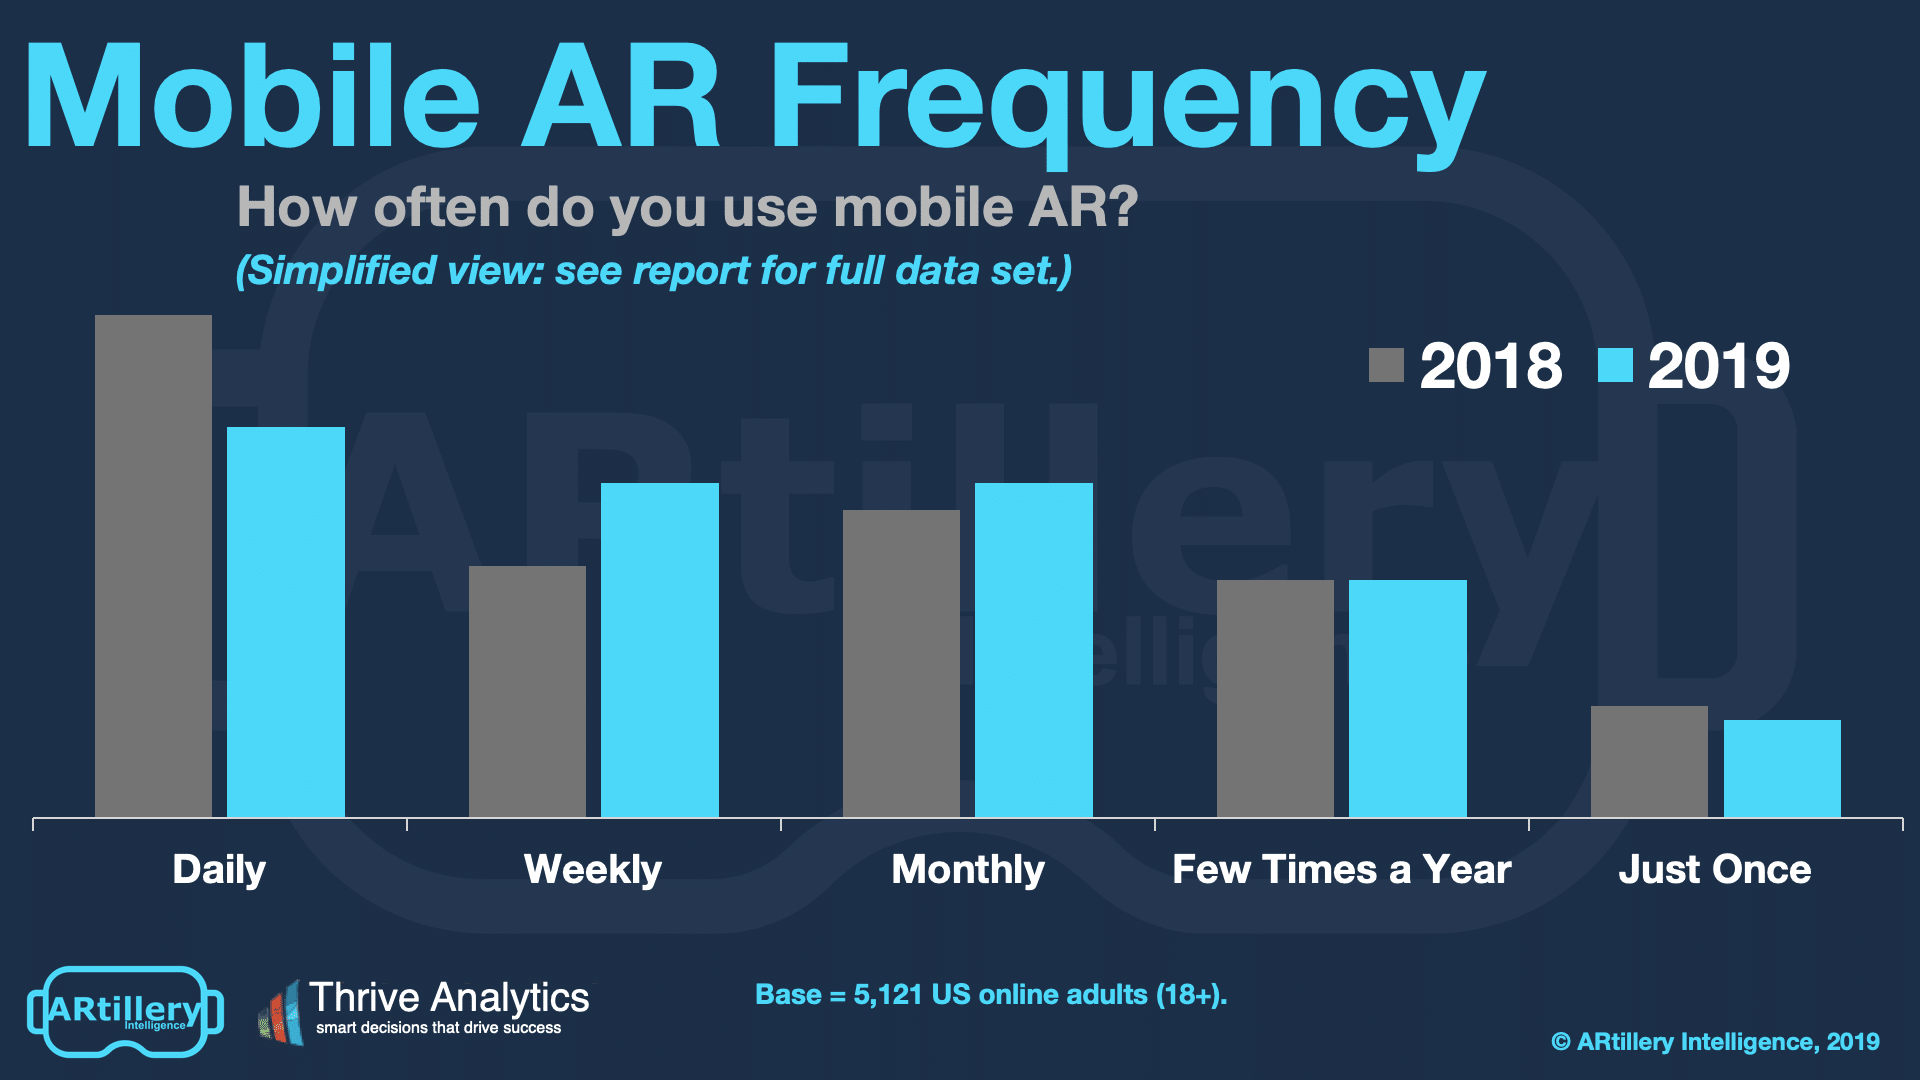
Drilling into the data, 82 percent of mobile AR users are active at least monthly, 52 percent do so at least weekly, and 28 percent daily. These are relatively high figures by mobile app standards, and indicate that the active-use challenges endemic to mobile apps aren’t as great in AR.
That’s the good news. The bad news is that daily active use is down from 2018. We attribute this to the novelty that drove last year’s daily active usage. There’s been a bit of a backlash to AR’s initial hype and inflated expectations, but active usage will rebound as AR evolves.
Deeper Dive: Frequency + Content
Staying with the topic of frequency, we can gain added dimension by combining the variables that have been examined so far. In other words, what types of AR experiences are driving the most repeat usage? And how does reported AR frequency map to the types of AR that are being used?
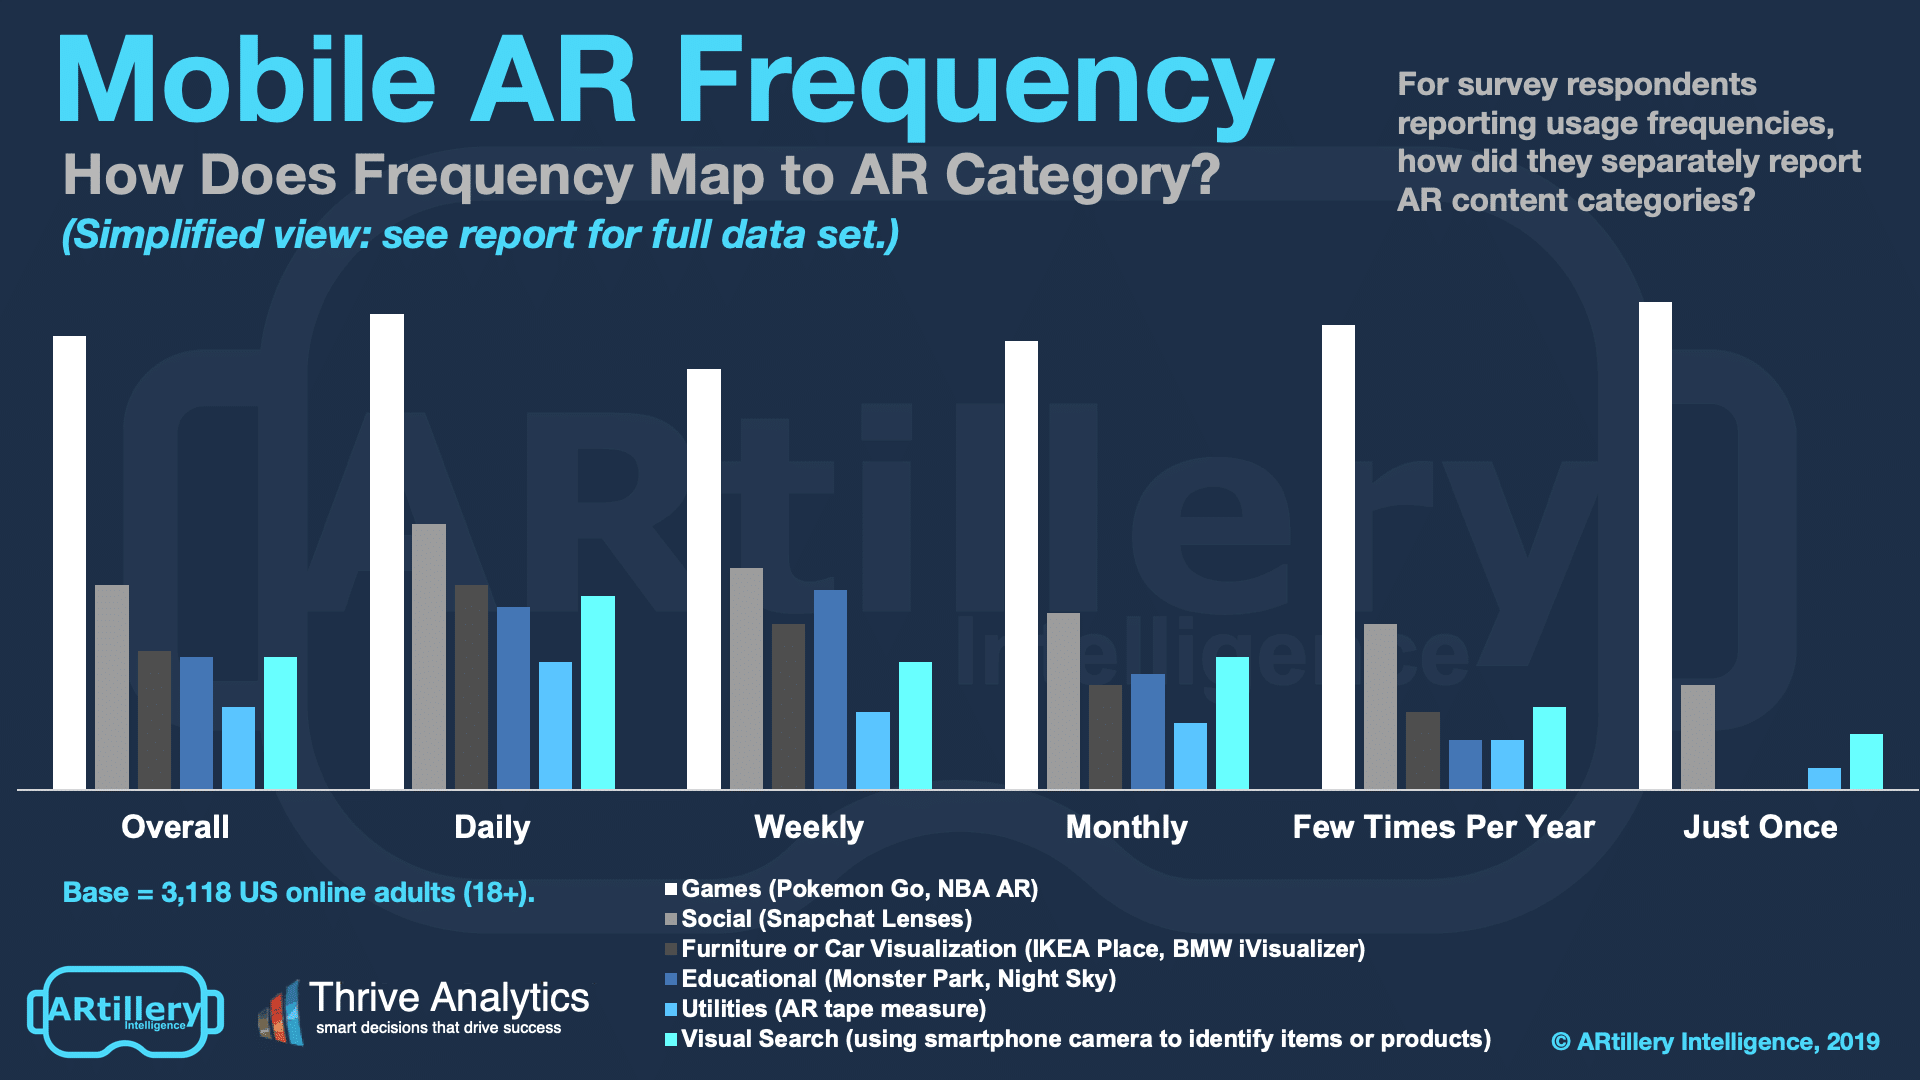
To do this, we cross-referenced some of the data. For survey respondents reporting usage frequencies, how did they separately report AR content categories they’re using? Just like in the overall content breakdown, AR gaming leads various usage frequency levels.
But going deeper into AR categories at different frequency levels reveals new insights. For example, social AR and product visualization were used most by respondents who reported daily use. This indicates these use cases are naturally recurring and can boost user engagement.
Visual search had an even greater divergence of use across frequency levels. Its share of users was greatest among those reporting daily AR use (35 percent) compared to weekly (23 percent) monthly (24 percent) or just once (10 percent). It’s yet another strong signal for visual search.
This frequency metric joins the natural business models for the above use cases. Together they indicate where AR could drive substantial revenue. Games will be dominated by in-app purchases (stemming from the model in mobile gaming), Social AR will be monetized through ads.
Product visualization will meanwhile include ad support and cost-per-action commerce. The same goes for visual search. There will be a high-intent use case for AR-based product searches when in close proximity to the subject. But the revenue models are still in early development.
See more details about this report or continue reading here.
For deeper XR data and intelligence, join ARtillery PRO and subscribe to the free AR Insider Weekly newsletter.
Disclosure: AR Insider has no financial stake in the companies mentioned in this post, nor received payment for its production. Disclosure and ethics policy can be seen here.