
This post is adapted from ARtillery Intelligence’s latest report, VR Usage & Consumer Attitudes, Wave III. It includes some of its data and takeaways. More can be previewed here and subscribe for the full report.
How do consumers feel about VR? Who’s using it? What devices and apps do they use? And what do they want to see next? Perhaps more importantly, what are non-users’ reasons for disinterest? And how can VR players optimize product strategies accordingly?
These are key questions that our research arm ARtillery Intelligence set out to answer. Working with Thrive Analytics, they presented questions to more than 3,100 U.S. adults in Thrive’s established survey engine. And they’ve analyzed the results in a narrative report.
This follows similar reports completed over the past two years. Wave III of the research now emboldens the perspective and brings new insights and trend data to light. All three waves represent a collective base of 7,065 U.S. adults for a robust longitudinal analysis.
This week, we’ll dive into the breakdown of VR activities users are most interested in, and the parts of the experience they want to see improved.
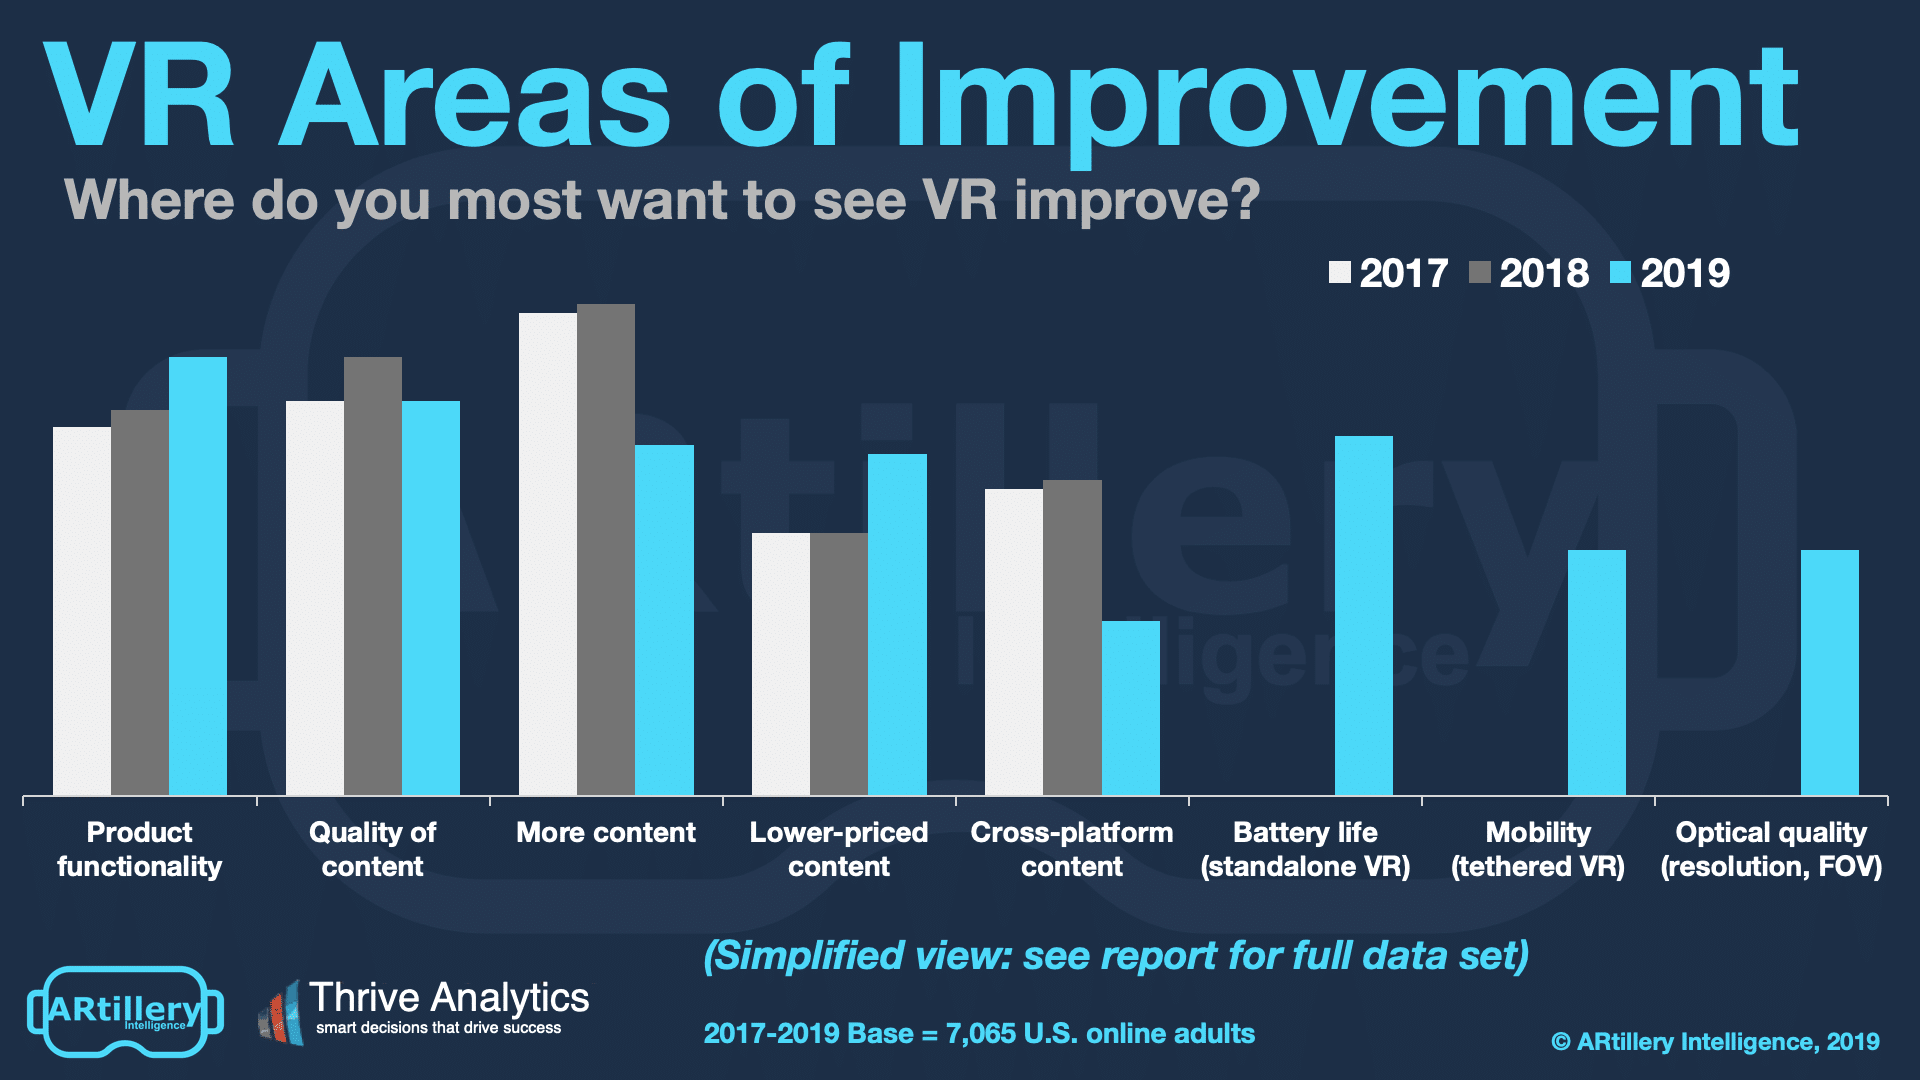
Room For Improvement
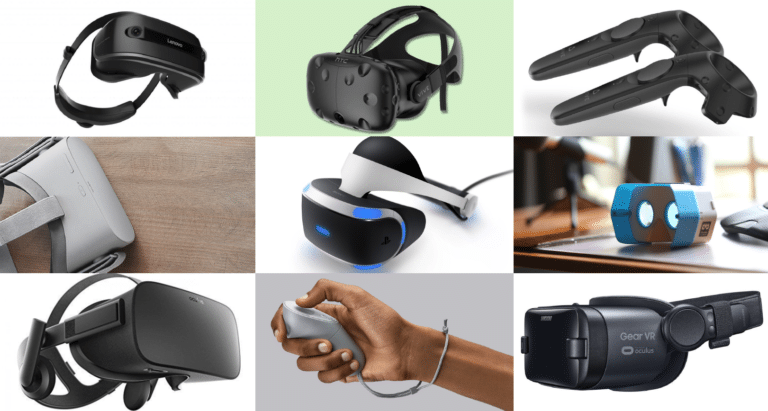
Picking up where we left of last week in looking at VR satisfaction, What do VR users want to see improved? On functional measures, battery life in standalone VR ranks high (41%). This is likely due to Oculus Go’s low battery life – the biggest complaint for an otherwise-revered device.
Content is another factor. Past survey waves were all about content quantity, but this year is defined by growing demand for content quality (45%). Quantity is less of an issue this year because it’s been satisfied by to some degree by Oculus Go’s relatively large content library.
Or as we wrote last year:
…The challenge today is a classic “chicken & egg” dilemma… there isn’t enough content to compel mass adoption… [nor] enough of an installed hardware base to compel content creators to invest time and money… We’ll see this dilemma naturally alleviate over time, as more content is created, and more devices are sold, in a sort of slow-moving step function… Invoking Oculus Go yet again, it could help accelerate that step function. It enters the market with more than 1,000 compatible apps, due to backwards-compatibility with Gear VR.
We invoke this passage from last year’s report because it represents an important trend that we’ll see continue with Oculus Go, not to mention Quest. The latter launches with 50 titles including the popular Beat Saber, Rec Room and YouTube app, which has access to one-million 360° videos.
Reframing Entertainment
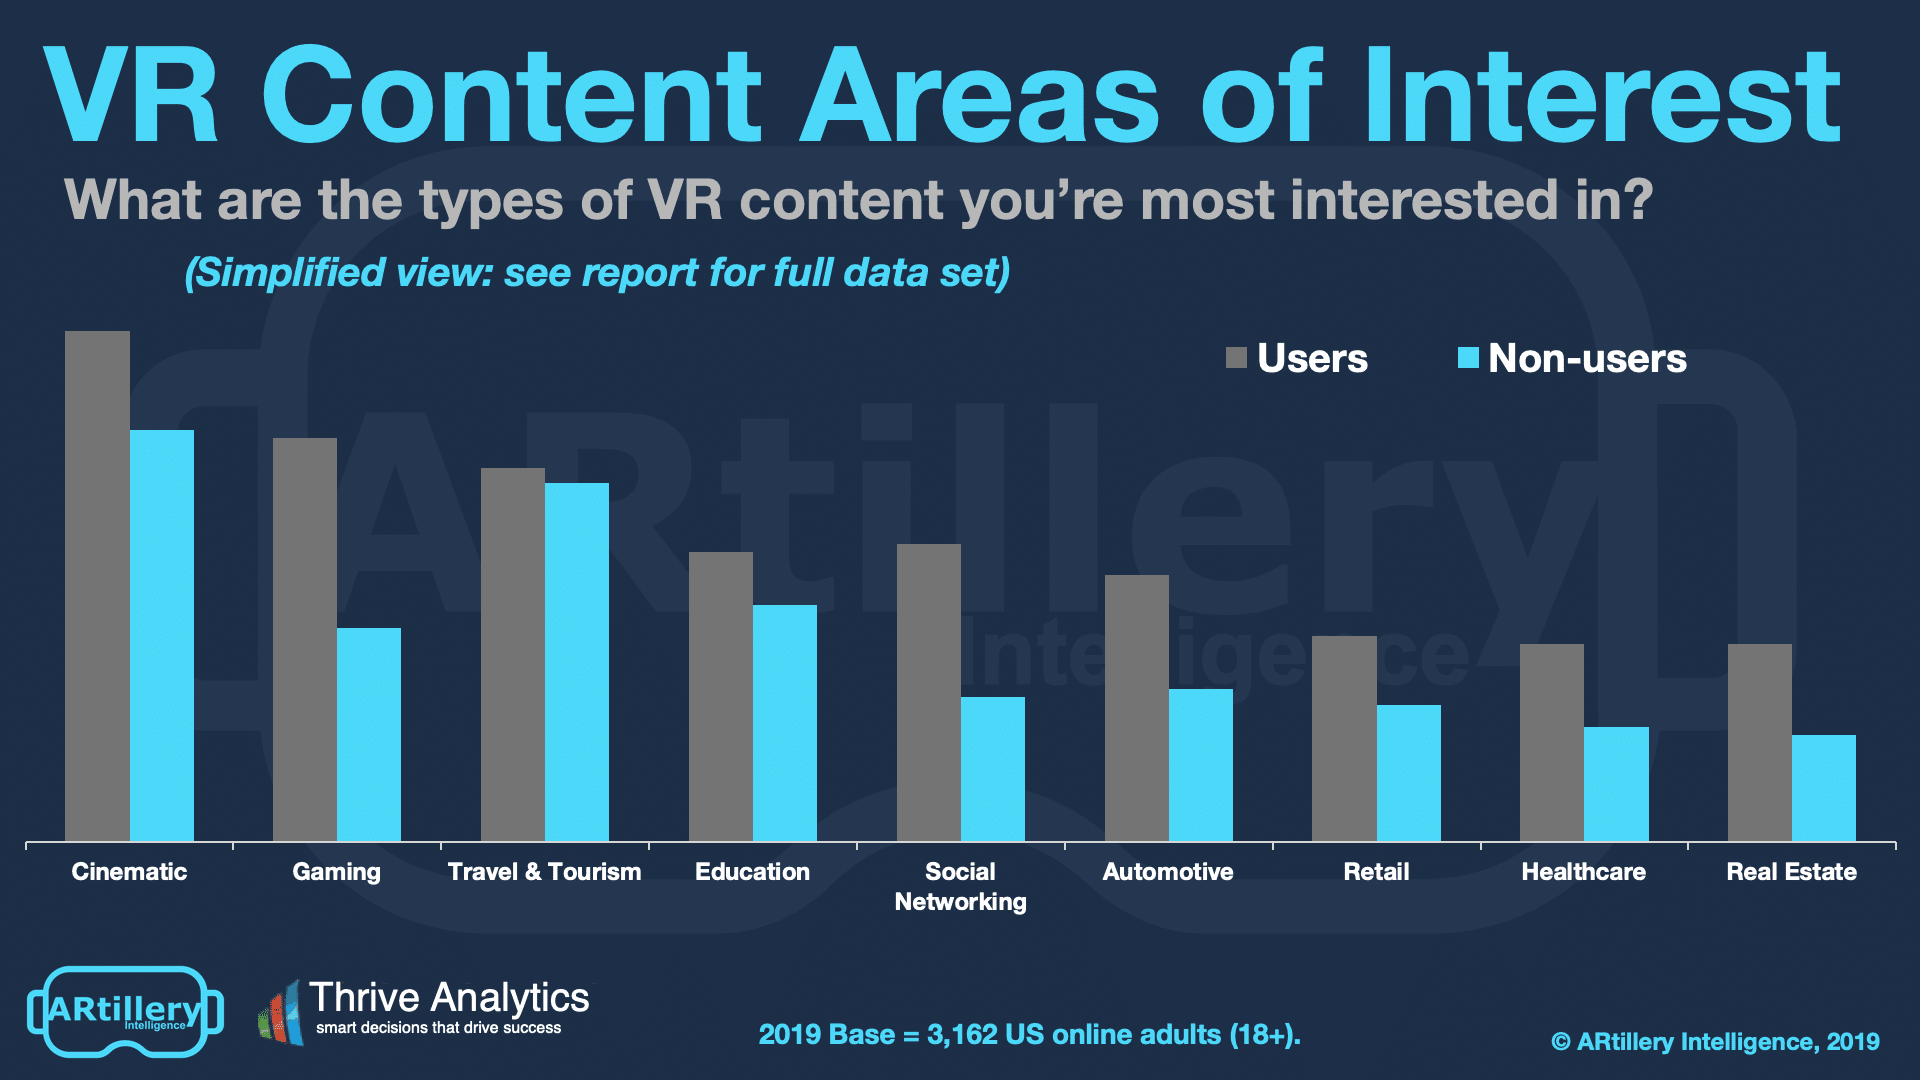
Content is a key issue for VR users, as examined above. That goes for both quantity and quality, the latter gaining mindshare in this survey wave. Going one level deeper, what types of content are VR users and non-users most interested in? The results are mixed and mostly as expected.
Topping the list is cinematic content, such as watching 2D movies in a virtual environment. Among VR users, that’s followed by gaming, travel & tourism, social networking and education. The story is mostly the same for non-users except that there is a big drop (to 28%) in gaming interest.
These responses aren’t surprising but it’s notable that users are most interested in what they know: Cinematic content. Though 2D movies and TV don’t harness VR’s benefits and immersion, they’re what consumers want. This will evolve but is meanwhile a key finding for VR players.
As we’ve examined, eventual VR successes will design native experiences that can only exist in VR. They’ll apply unique capabilities to immerse users in 3D sensory experiences. This will represent a learning curve for developers, just like we saw with native smartphone app design.
In the meantime, consumers need time to wrap their heads around this revolutionary jump in content formats. Their desired VR activities will continue to be conceptualized in the activities they know. That is… until new/native experiences re-frame their thinking and their interests.
Cross Section
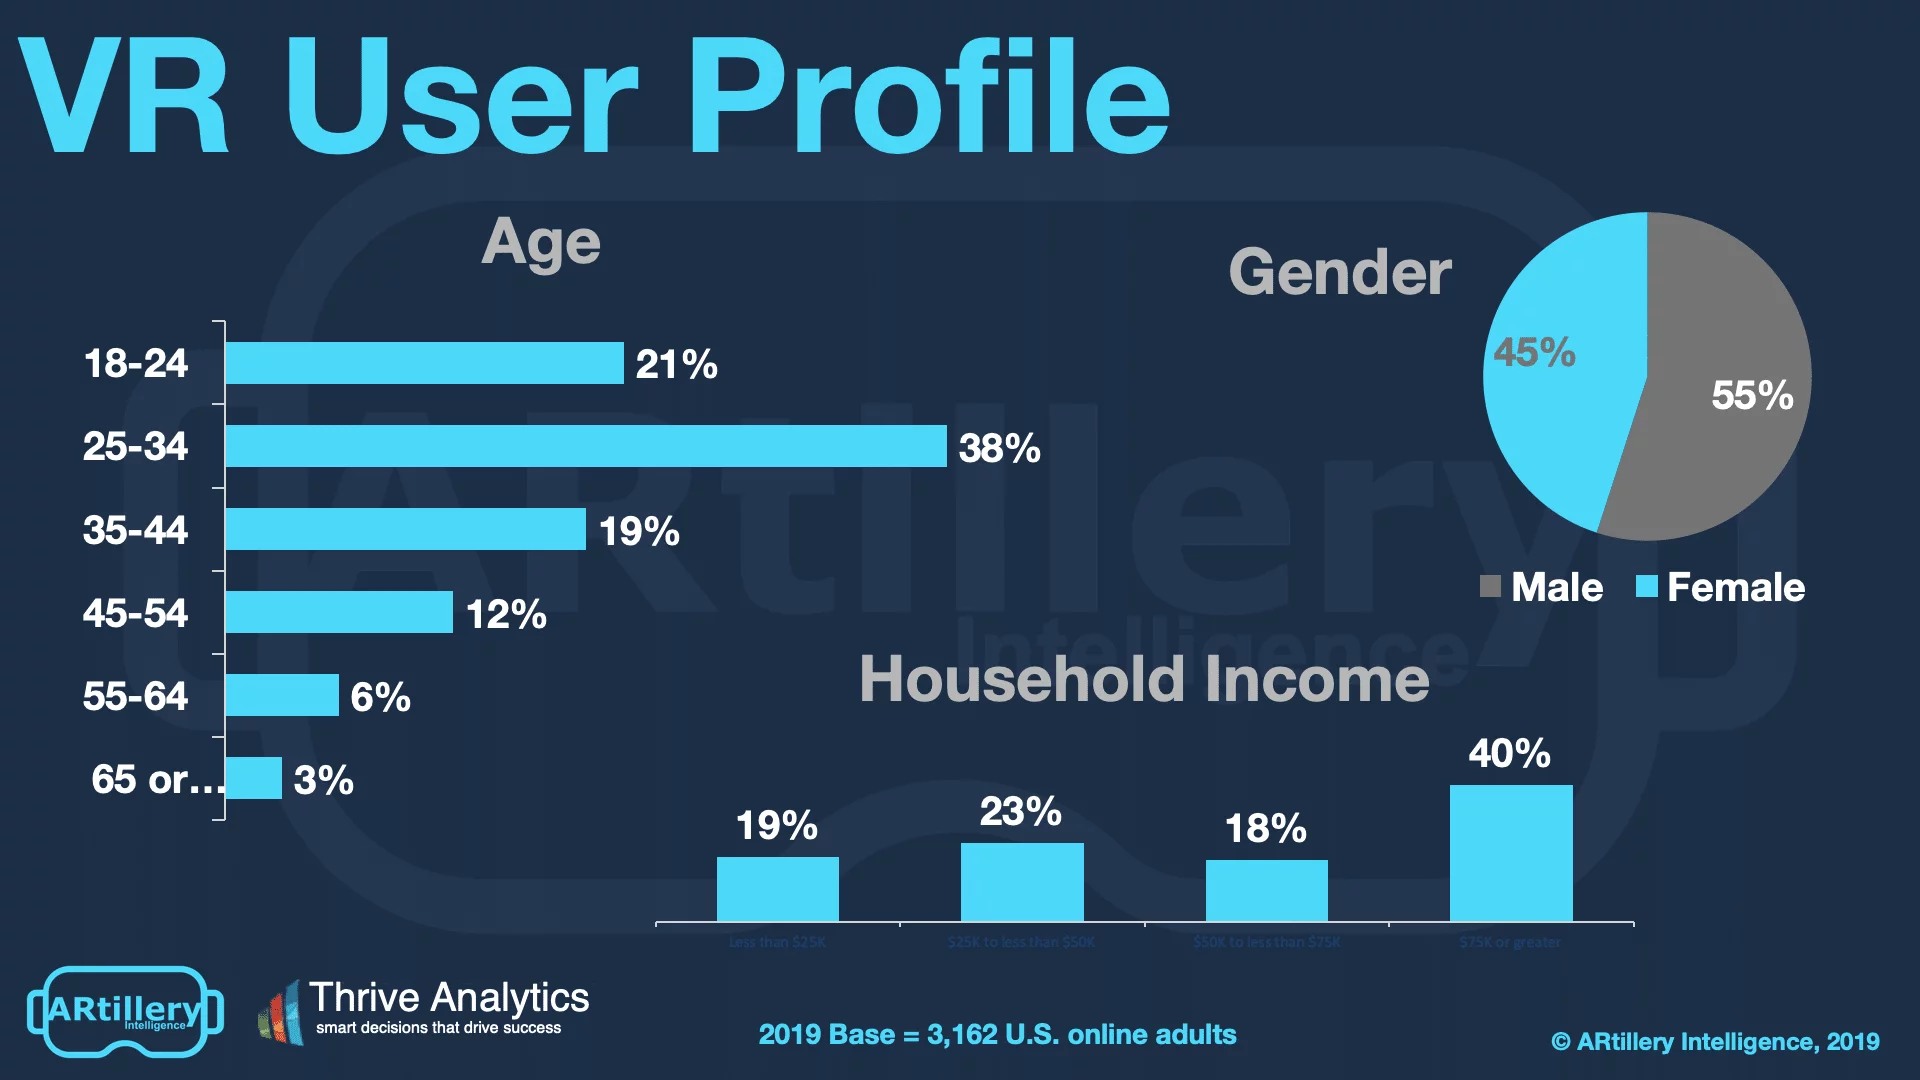
To add context to survey findings throughout this report, who’s answering the questions? It includes more than 3,100 U.S. adults. Going deeper into demographics and psychographics, the respondents break down as shown below. More detail and segmentation are available on request.
The survey sample spans a wide range of U.S. adult consumers. Gender breaks down fairly evenly, while age and income levels skew towards more attractive demographic groups. That includes active and buying-empowered age groups (25-34), and high-income homes ($75K+).
See more details about this report or continue reading here.
For deeper XR data and intelligence, join ARtillery PRO and subscribe to the free AR Insider Weekly newsletter.
Disclosure: AR Insider has no financial stake in the companies mentioned in this post, nor received payment for its production. Disclosure and ethics policy can be seen here.