
This post is adapted from ARtillery Intelligence’s latest report, VR Usage & Consumer Attitudes, Wave III. It includes some of its data and takeaways. More can be previewed here and subscribe for the full report.
How do consumers feel about VR? Who’s using it? What devices and apps do they use? And what do they want to see next? Perhaps more importantly, what are non-users’ reasons for disinterest? And how can VR players optimize product strategies accordingly?
These are key questions that our research arm ARtillery Intelligence set out to answer. Working with Thrive Analytics, they presented questions to more than 3,100 U.S. adults in Thrive’s established survey engine. And they’ve analyzed the results in a narrative report.
This follows similar reports completed over the past two years. Wave III of the research now emboldens the perspective and brings new insights and trend data to light. All three waves represent a collective base of 7,065 U.S. adults for a robust longitudinal analysis.
Picking up where we left off last week, we’ll dive into the activities that VR users and non-users report that they’re most interested in.

Demand Signals
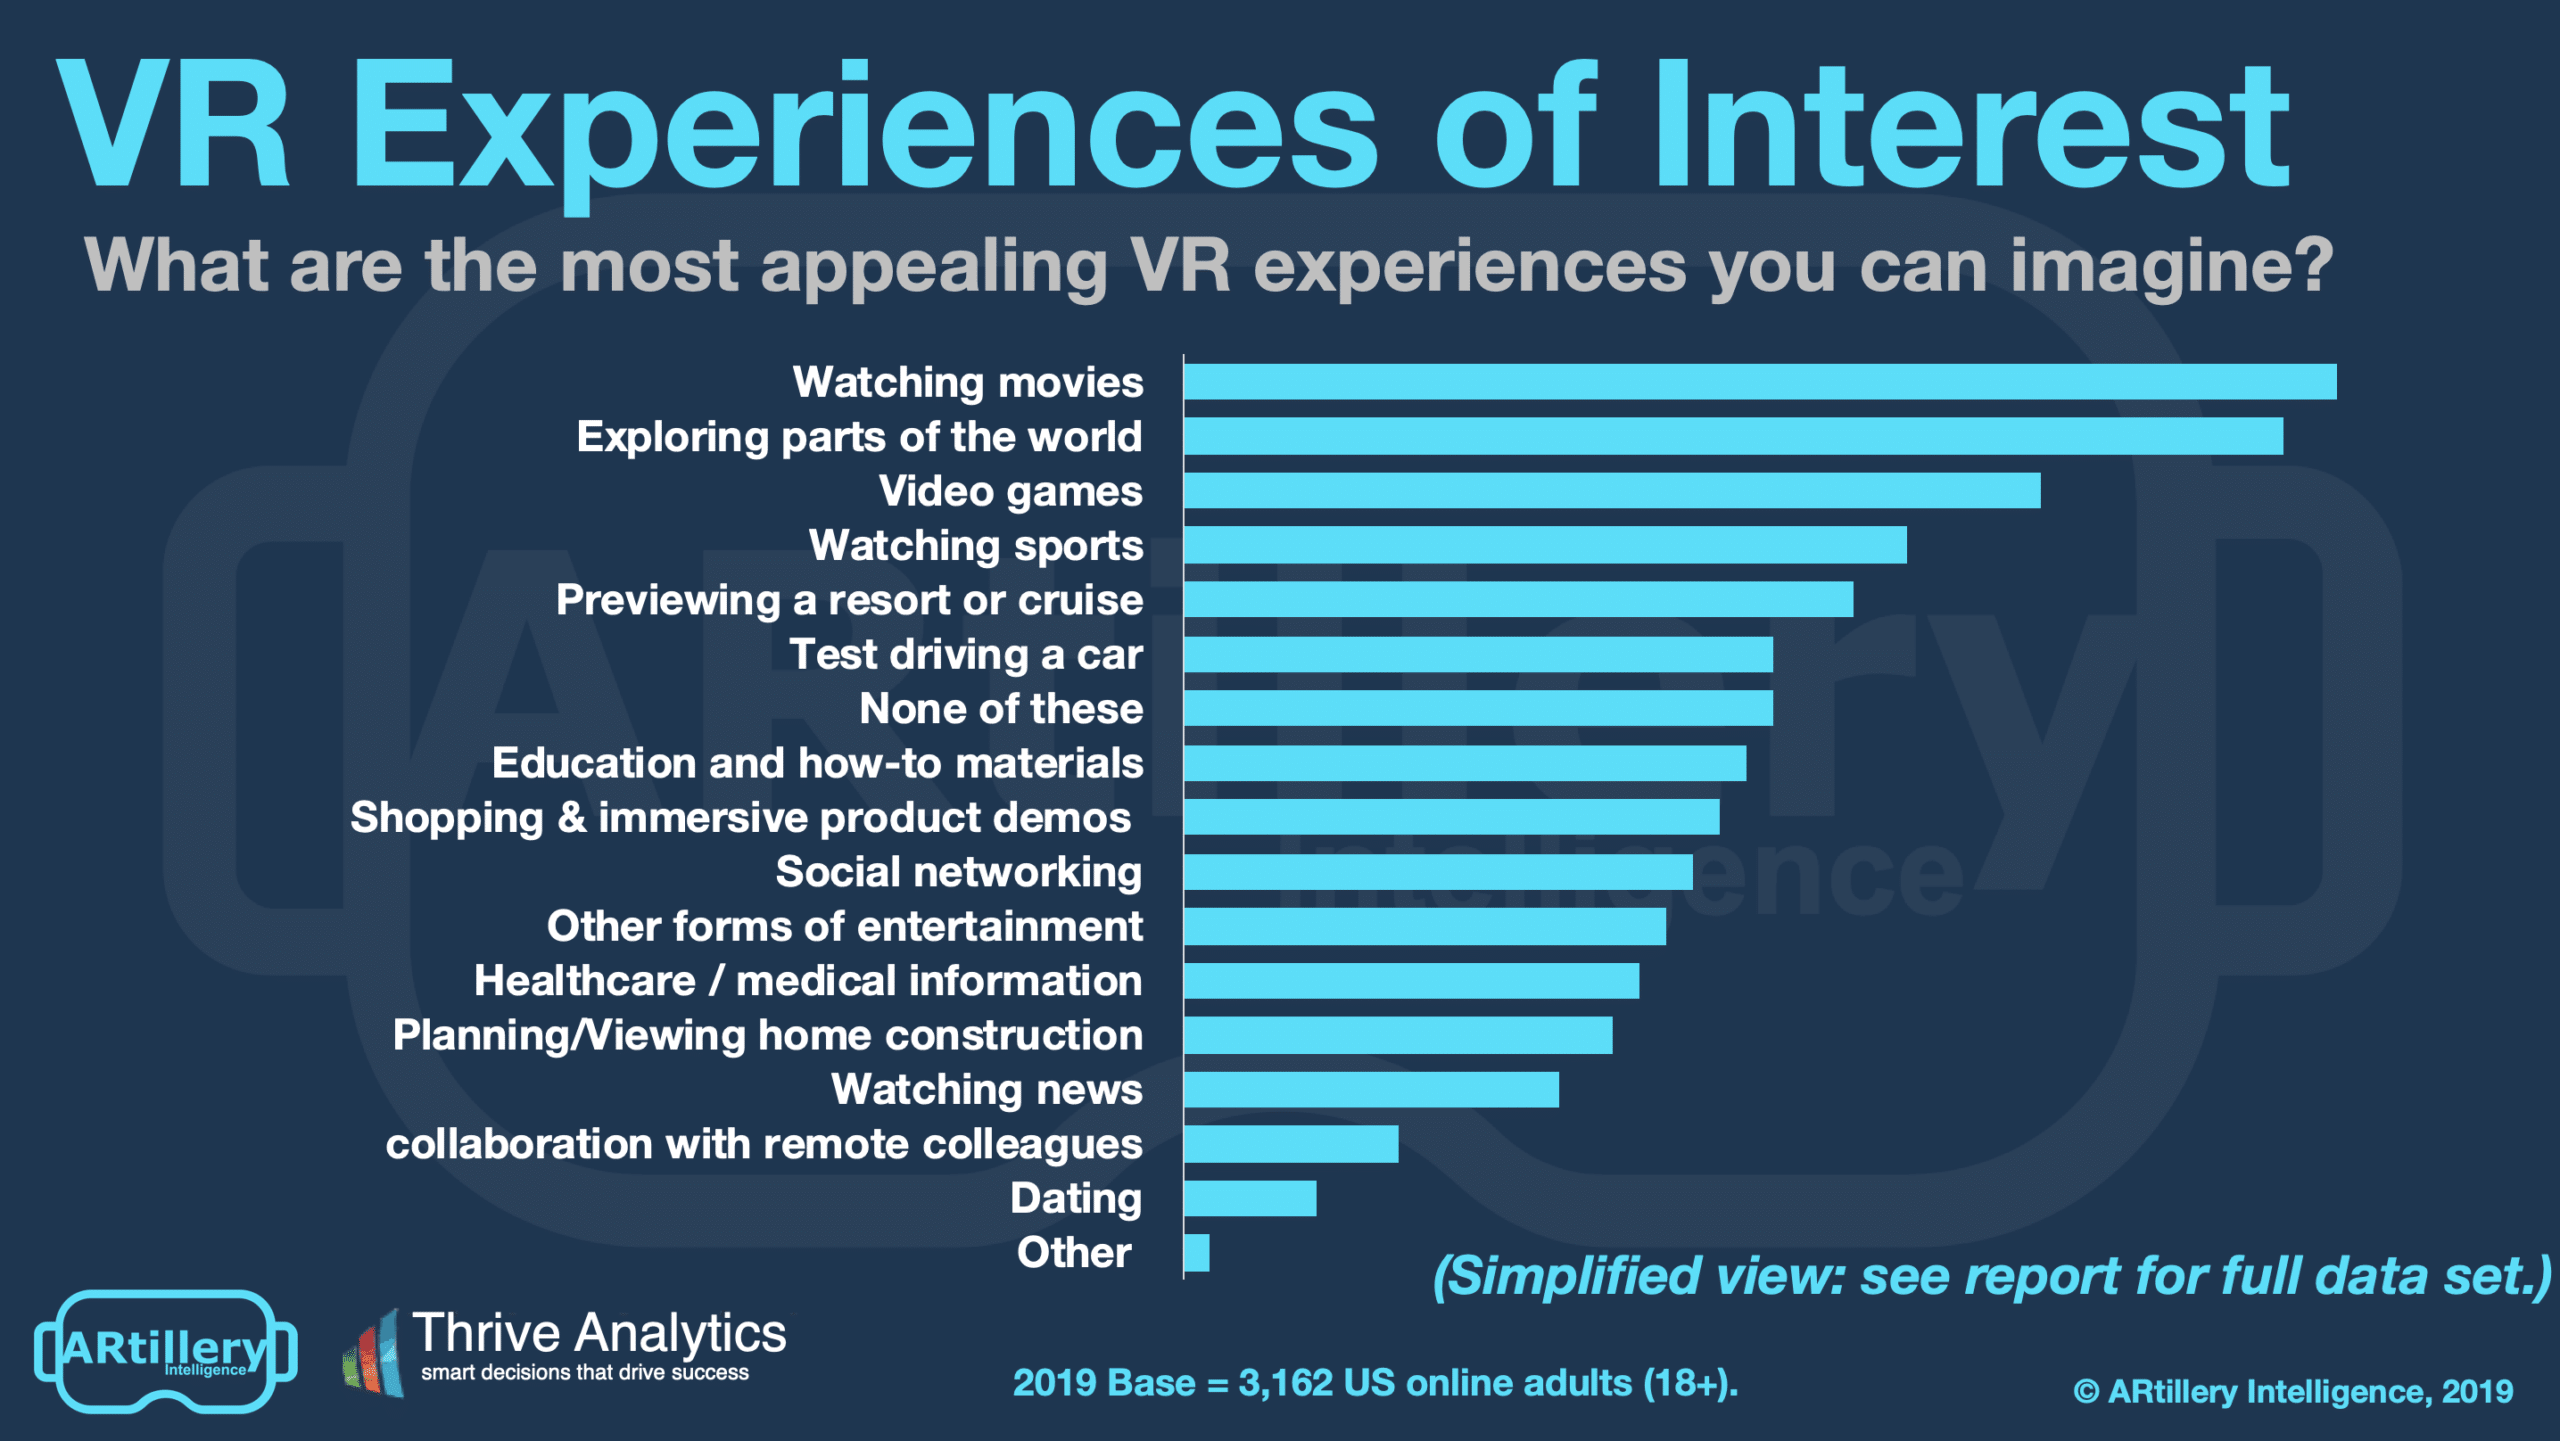
Adding to our consumer polling on VR attitudes, what activities do they want to see next? This overlaps slightly with our earlier analysis on VR content types but is more broadly about imagining VR experiences. The question was posed to both users and non-users.
The top result was watching movies (43 percent), followed by exploring parts of the world (41 percent), video games (32 percent), watching sports (27 percent), previewing a resort or cruise (25 percent) test-driving a car (22 percent) and how-to or educational experiences (21 percent).
Interestingly, these results are a mix of “native” VR activities (fully immersive 3D) and standard 2D content that has been brought into a VR environment (e.g. watching movies). The fact that the latter represents the most popular activity is telling of the very early stage in which VR remains.
As we’ve examined, eventual VR successes will design native experiences. In other words, they can only exist in VR. They’ll apply unique capabilities to immerse users in 3D sensory experiences. This will represent a learning curve for developers, just like smartphone app design.
Points of Intersection
In the meantime, consumers need time to wrap their heads around this revolutionary jump in content. Their desired VR activities will continue to be conceptualized in the activities they know. That is, until new/native experiences are offered that re-frame their thinking and their interests.
Meanwhile, activities ARtillery Intelligence believes are worth keeping an eye on include remote collaboration, social interaction, and remote immersive shopping. These are areas we’re examining and project strong long-term use cases, despite lower consumer interest today.
Either way, these consumer sentiments should be considered when evaluating VR’s points of intersection with existing business. For example, online travel, car shopping, and sports broadcasting should examine these sentiments when designing product road maps.
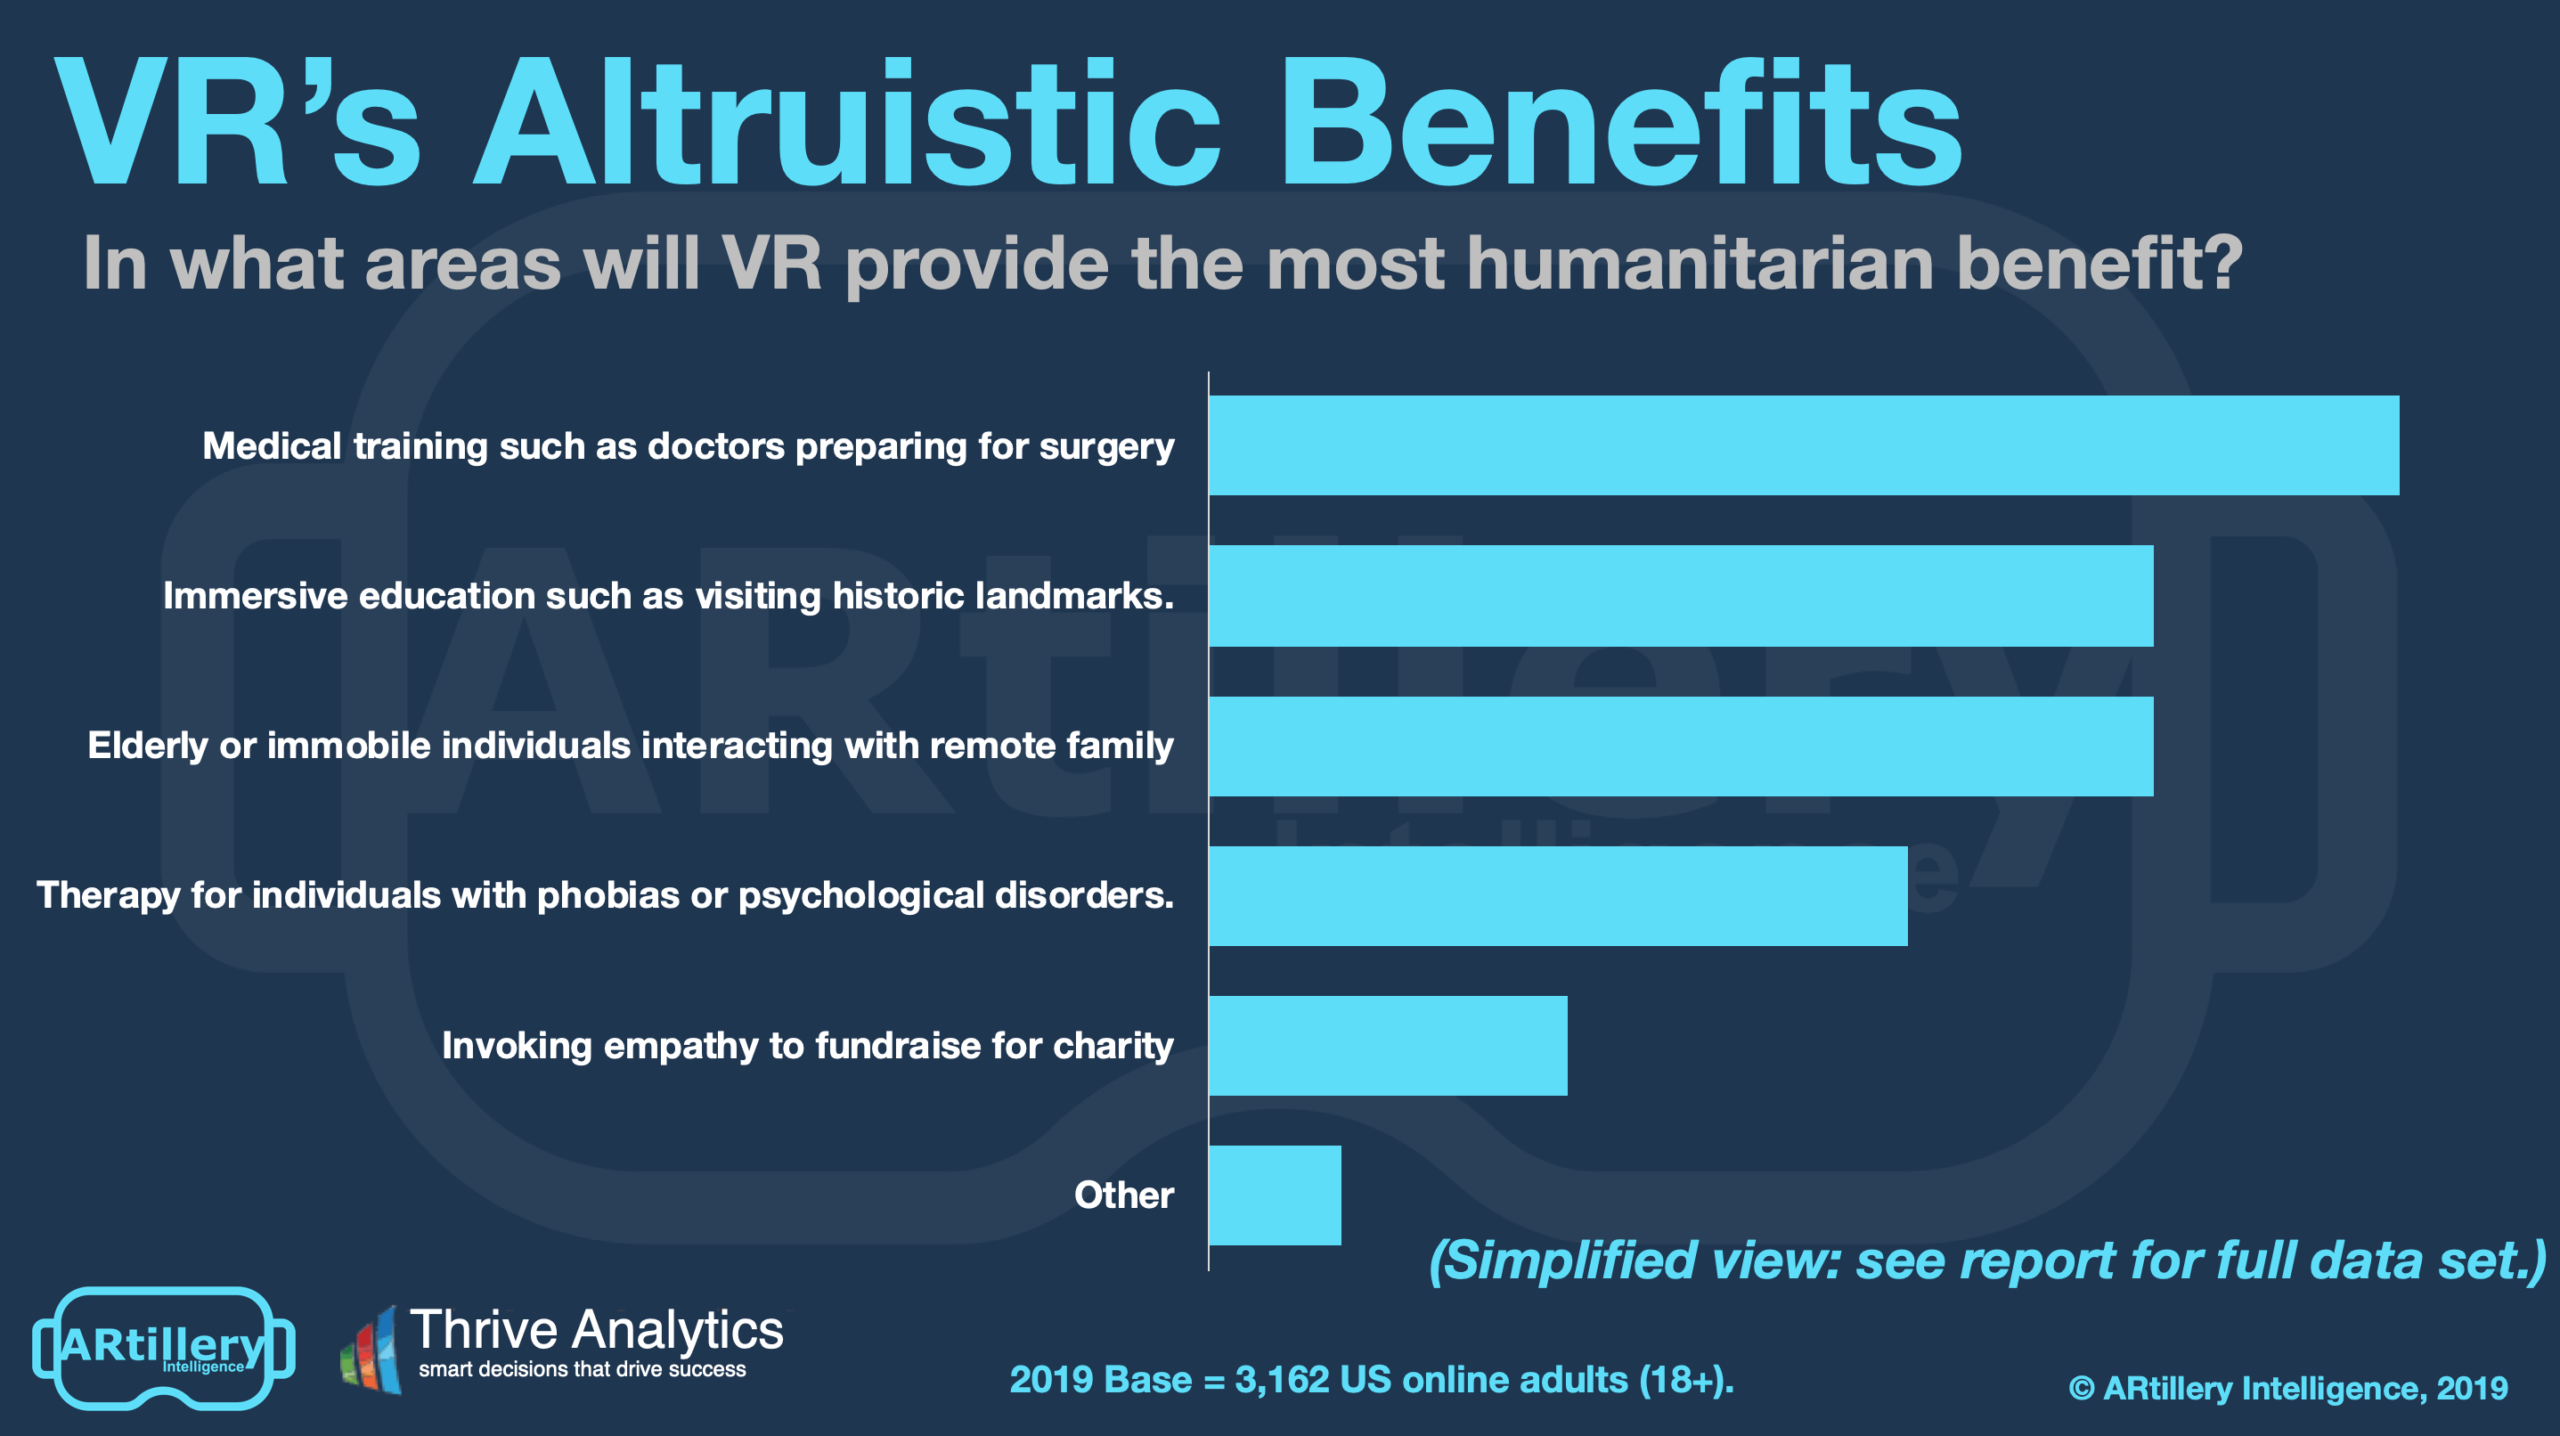
As for altruistic VR applications – those that serve a greater good – respondents rated medical training as the top use case (63 percent). That was followed by education, (50 percent) communications for the elderly (50 percent) and mental health therapy (37 percent).
Strategic Implications
One of the key themes throughout this report is the stark difference in sentiment between VR’s current users and those who haven’t tried it yet. Users report impressively-high satisfaction and engagement. Non-users conversely show explicit disinterest and price sensitivity.
These findings hold important lessons for VR proponents. Once again, it’s a double-edged sword: VR’s highly visceral interface captivates users. But that same orientation makes it so that the advantages can’t be communicated adequately by traditional methods of product marketing.
People need to experience VR before they convert, which presents logistical challenges in pushing that “first taste” at scale. Our sister report on mobile AR had similar findings, but its adoption barriers are lower due to “zero cost hardware” (existing smartphone) and less bulk.
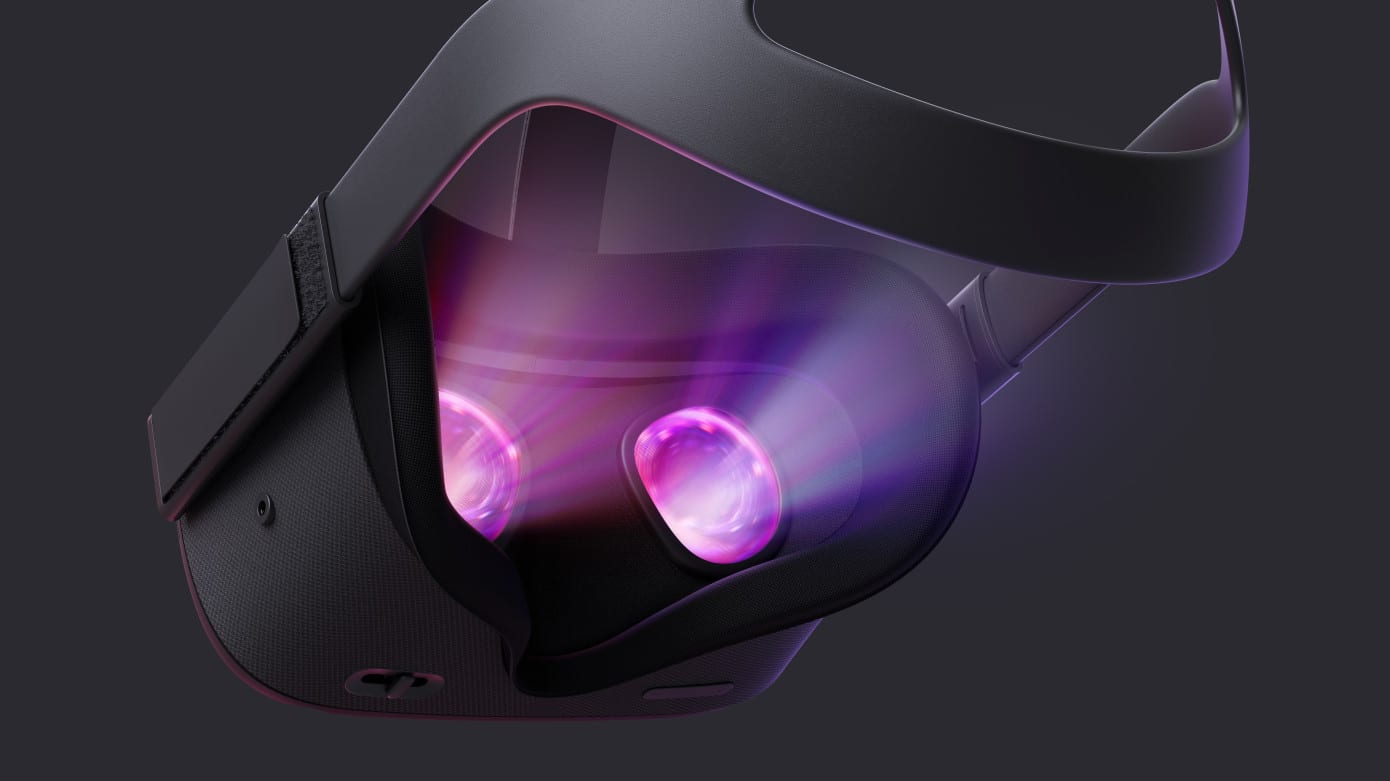
This is where standalone VR will accelerate adoption, due to lowering both cost and usage friction. The category is represented best by the $199 Oculus Go and the more recently-launched Quest. The former has more market tenure and we view it as an important VR “gateway drug.”
Start Small
For VR developers, the above statement has important implications. Though Oculus Go has a more basic user interface and less sophisticated positional tracking (rotational head tracking versus full-6D spatial movement), it will be a strategic point of entry to a large addressable market.
But based on its unique capabilities, it requires optimizing content accordingly. For example, the device’s 72 Hz processing, 3 degrees of freedom (3DOF) and low interactivity make it better suited to “lean-back” experiences. That means movies (which scored high) and casual games.
This follows a core native design principle that should guide VR developers: Optimize software for the tools you have now, rather than getting carried away in features that the device can’t or shouldn’t handle. Oculus CTO John Carmack advocates this optimization strategy.
“Some of [my favorite VR experiences] are clearly very synthetic worlds where it’s nothing but cartoony, flat-shaded things with lighting but they look, and they feel good,” he said. The lesson: a “low-poly” approach is better if it works, versus intensive graphics that the device can’t handle.
Most of all, it should be remembered that this optimization process will be a moving target. VR has a long way to go and will evolve quickly. But several points along that path will meanwhile represent value for those who can utilize available toolsets, and apply them in optimal ways.
Cross Section
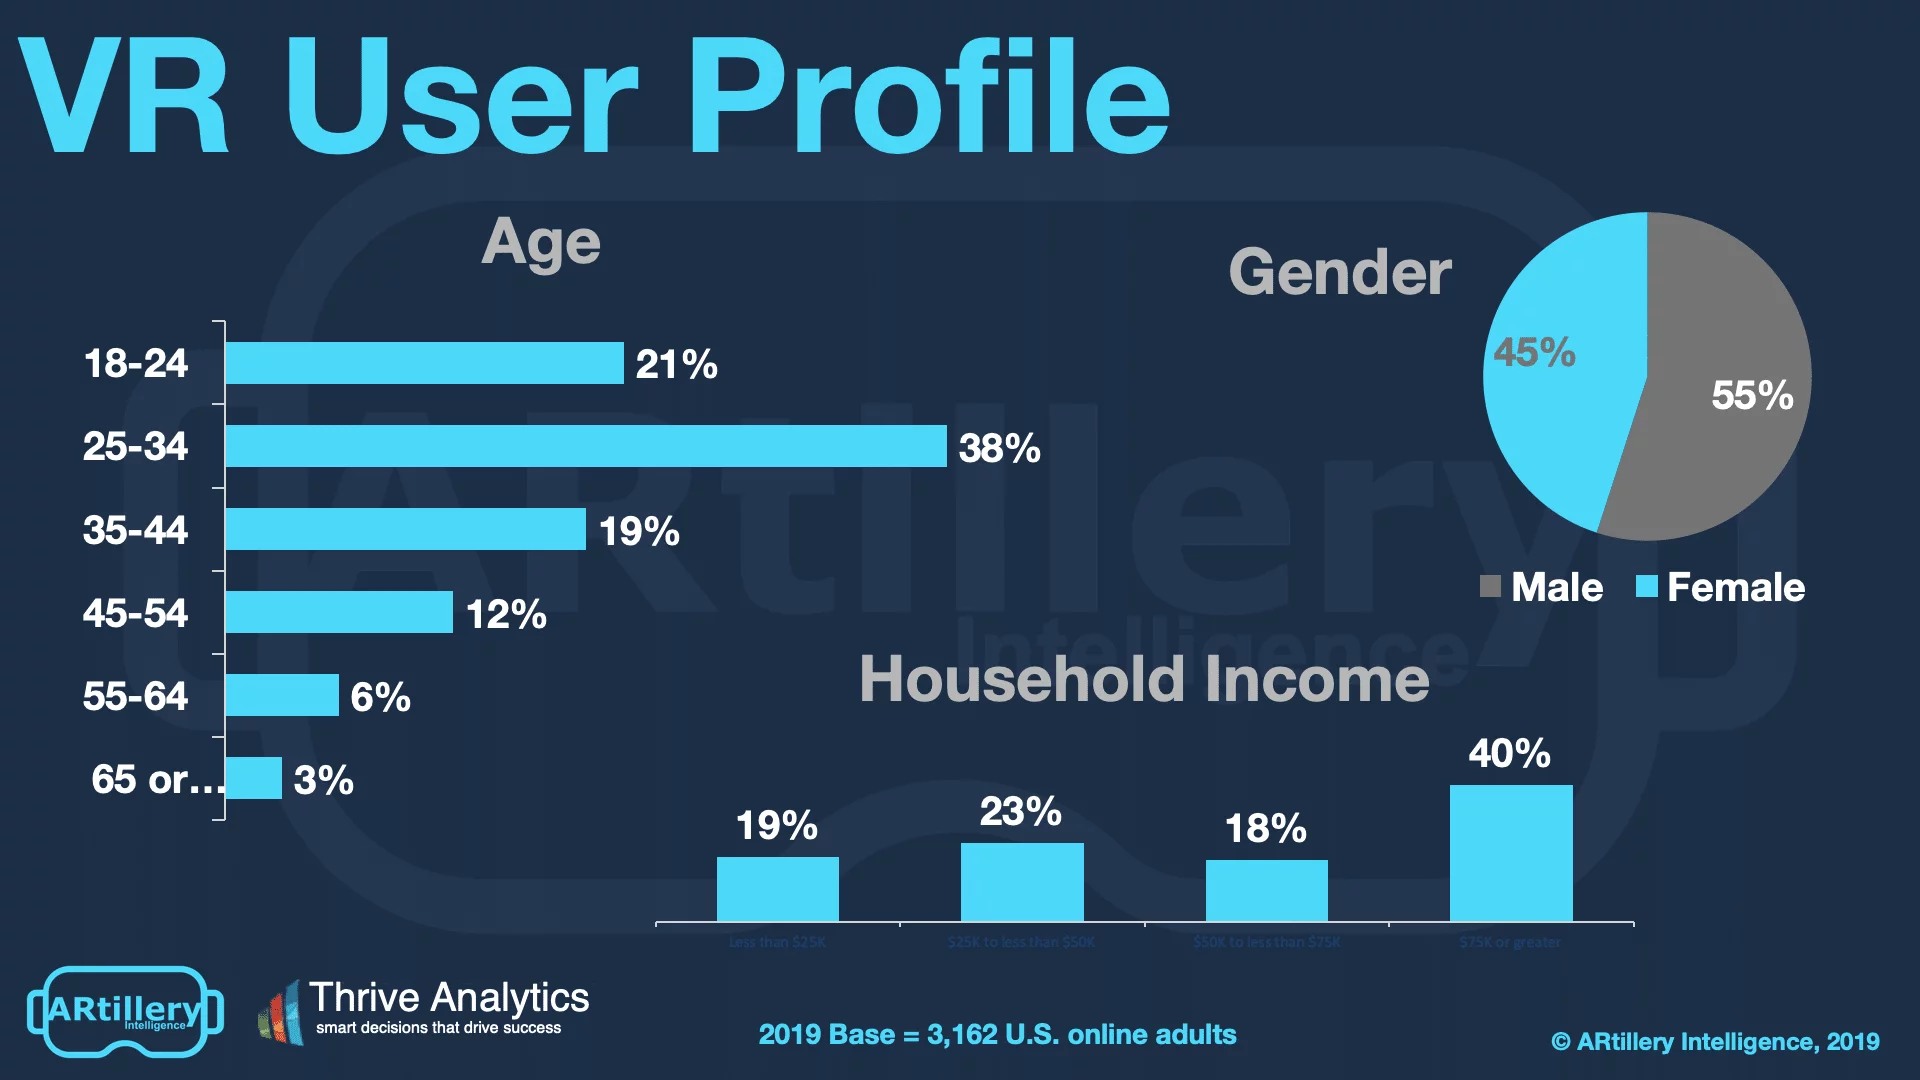
To add context to survey findings throughout this report, who’s answering the questions? It includes more than 3,100 U.S. adults. Going deeper into demographics and psychographics, the respondents break down as shown below. More detail and segmentation are available on request.
The survey sample spans a wide range of U.S. adult consumers. Gender breaks down fairly evenly, while age and income levels skew towards more attractive demographic groups. That includes active and buying-empowered age groups (25-34), and high-income homes ($75K+).
See more details about this report or continue reading here.
For deeper XR data and intelligence, join ARtillery PRO and subscribe to the free AR Insider Weekly newsletter.
Disclosure: AR Insider has no financial stake in the companies mentioned in this post, nor received payment for its production. Disclosure and ethics policy can be seen here.