
This post is adapted from ARtillery Intelligence’s latest report, VR Usage & Consumer Attitudes, Wave III. It includes some of its data and takeaways. More can be previewed here and subscribe for the full report.
How do consumers feel about VR? Who’s using it? What devices and apps do they use? And what do they want to see next? Perhaps more importantly, what are non-users’ reasons for disinterest? And how can VR players optimize product strategies accordingly?
These are key questions that our research arm ARtillery Intelligence set out to answer. Working with Thrive Analytics, they presented questions to more than 3,100 U.S. adults in Thrive’s established survey engine. And they’ve analyzed the results in a narrative report.
This follows similar reports completed over the past two years. Wave III of the research now emboldens the perspective and brings new insights and trend data to light. All three waves represent a collective base of 7,065 U.S. adults for a robust longitudinal analysis.
Picking up where we left off last week, we’ll dive into price sensitivity among VR users and non-users. How much are they willing to pay for VR? At what price points does demand inflect? And how does price sensitivity differ between VR users and non-users?
VR Price Sensitivity
Price is an important factor in VR adoption, just as it is with most products. But what are the specific ways that price is a gating factor to VR adoption? And more importantly, what price points represent triggers for consumer interest – or disinterest – in VR ownership?
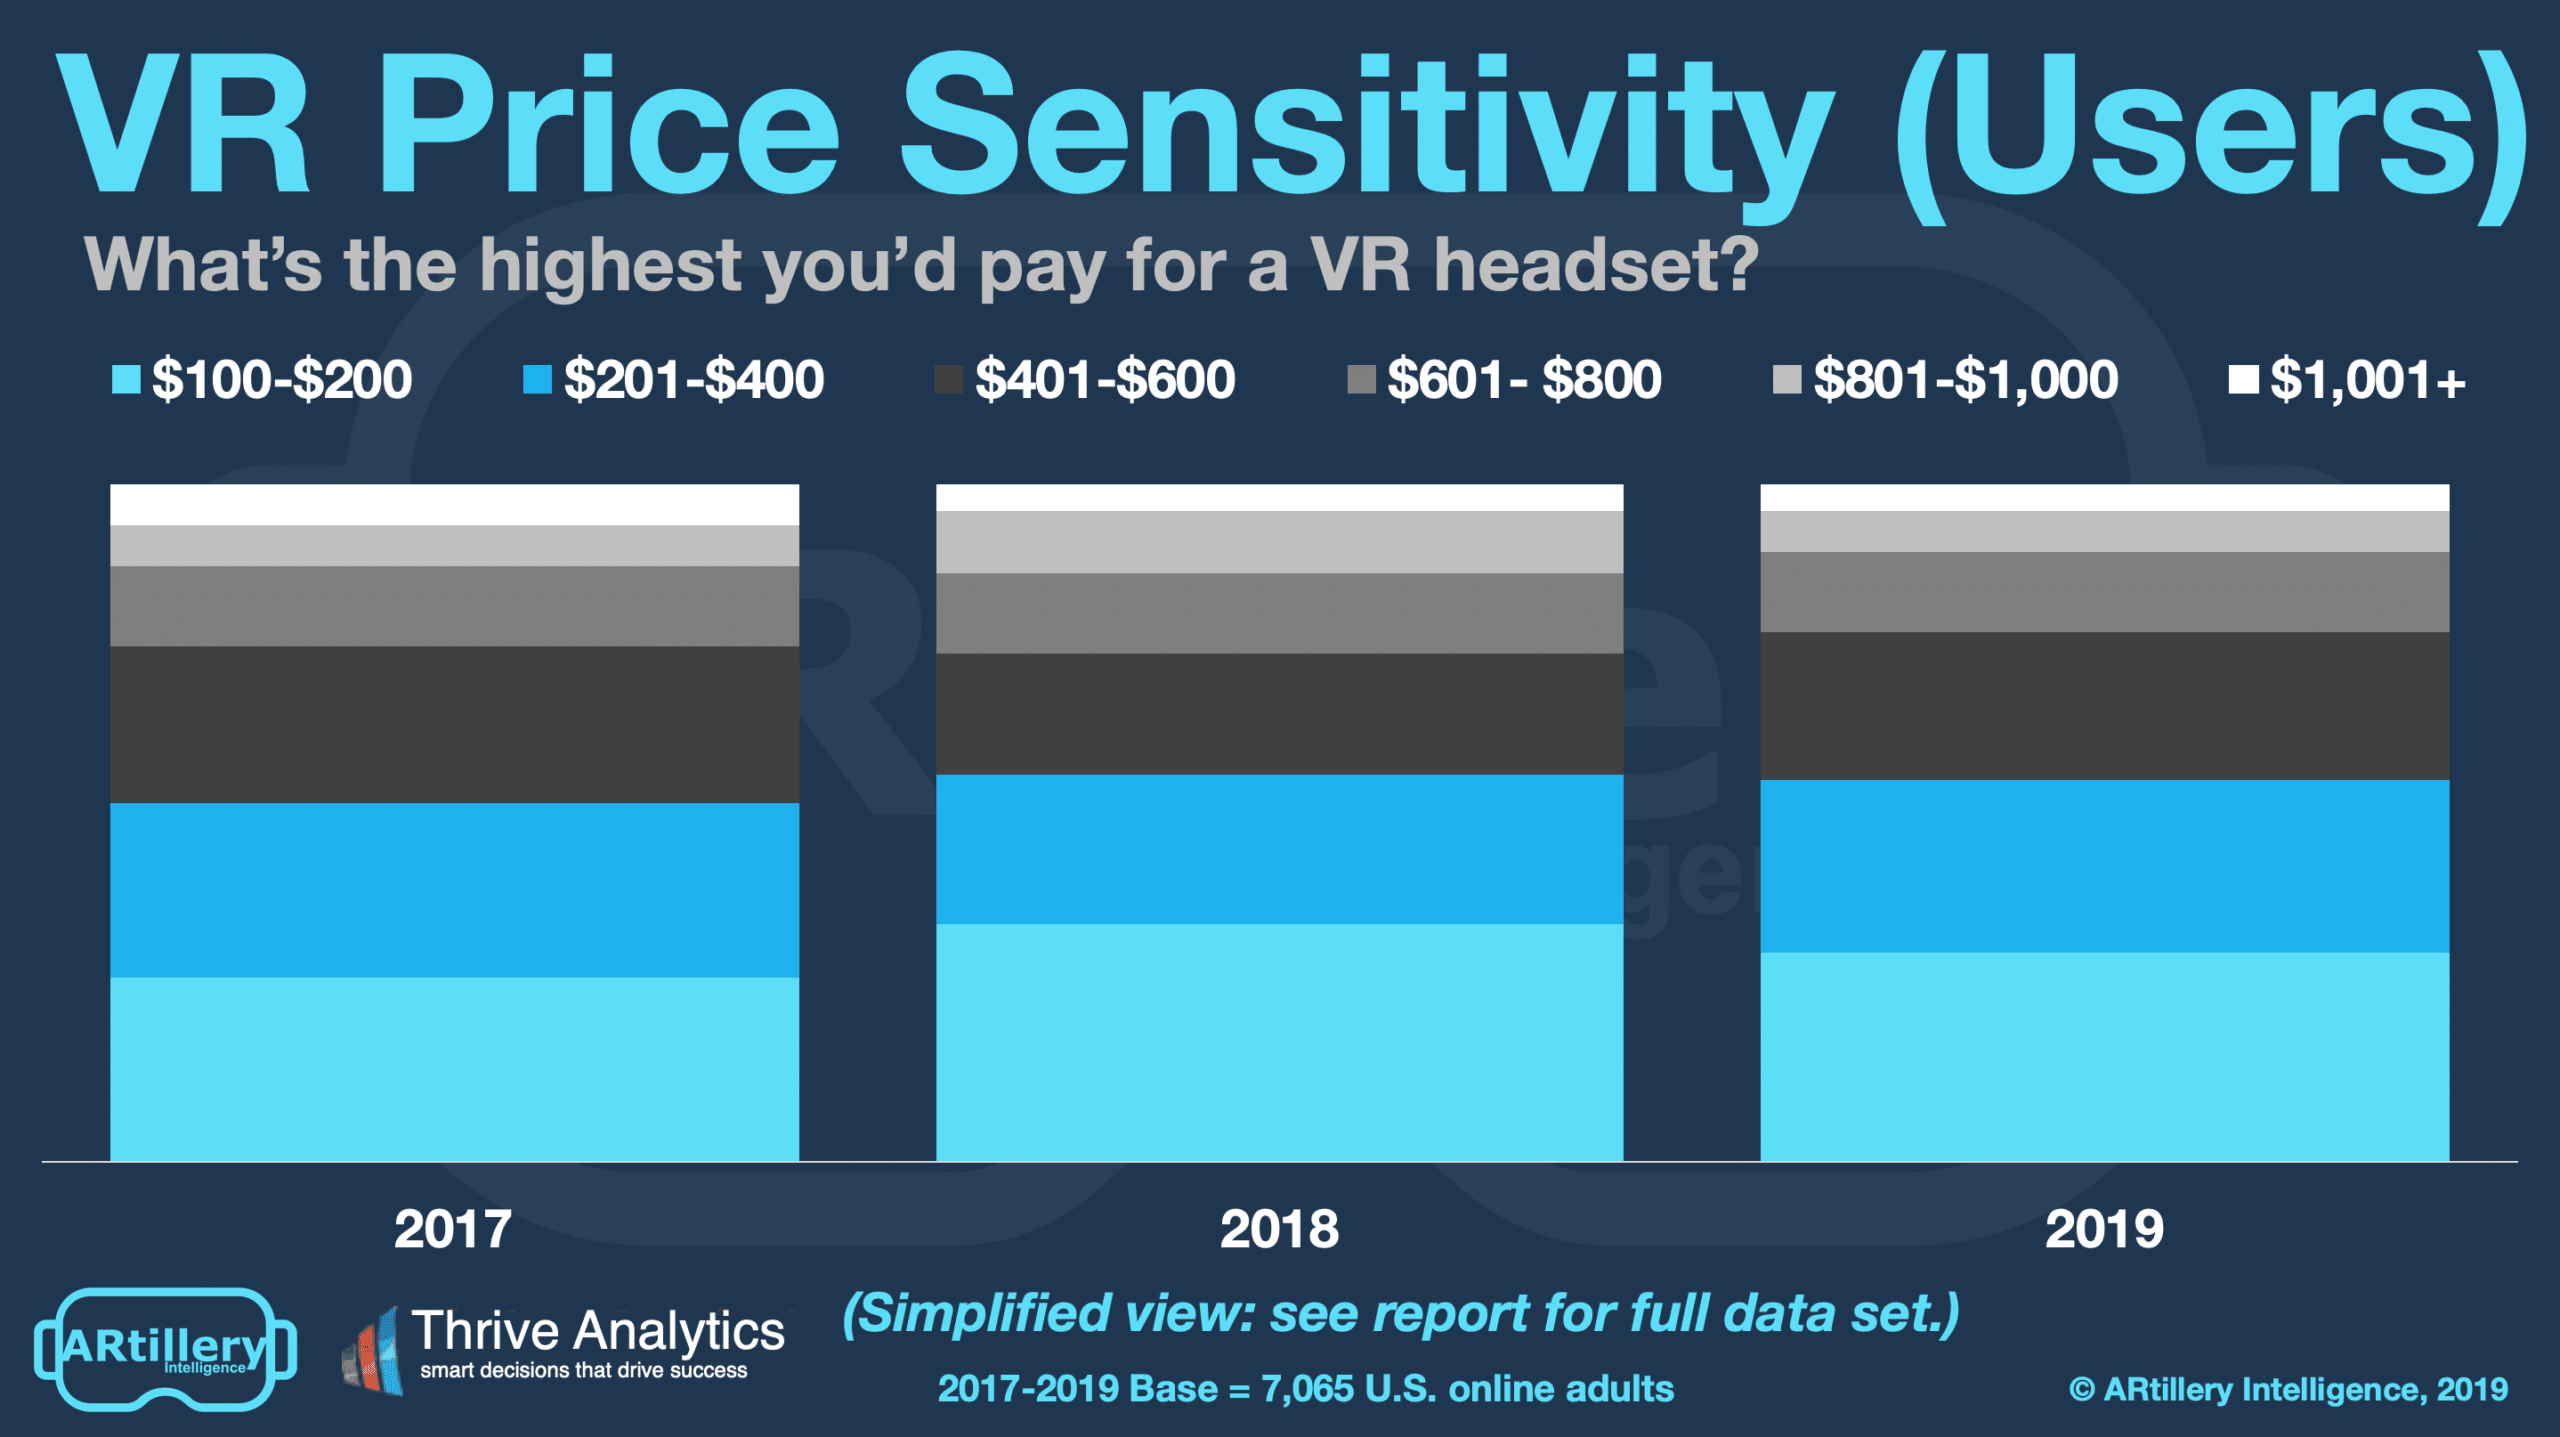
To begin, the greatest interest in VR not surprisingly exists at lower price points ($100 – $200). And the least interest lies with higher ones ($1001+). Given that tethered VR headsets primarily exist at those “all-in” (including PC) price points, they’re most susceptible to price sensitivity.
But breaking down lower price points is where things get interesting. Among current VR users (non-users examined next), the greatest interest is at the sub-$200 level (31%). That’s followed by sub-$400 (26%) and sub-$600 (22%), both of which are up four percentage points from 2018.
This tells us a few things. First, high satisfaction among VR users is validated by their increased willingness to spend up to $400 and $600 levels. Second, the two most popular price ranges line up identically with Oculus Quest and Oculus Go, priced at $399 and $199 respectively.
This is by design as Facebook/Oculus has done its homework on the market’s price elasticity. It has likely discovered figures similar to the below, and pinpointed price points that will move the most headsets, regardless of margin, pursuant to its loss-leader driven platform strategy.
Non-Users: A Different Tune
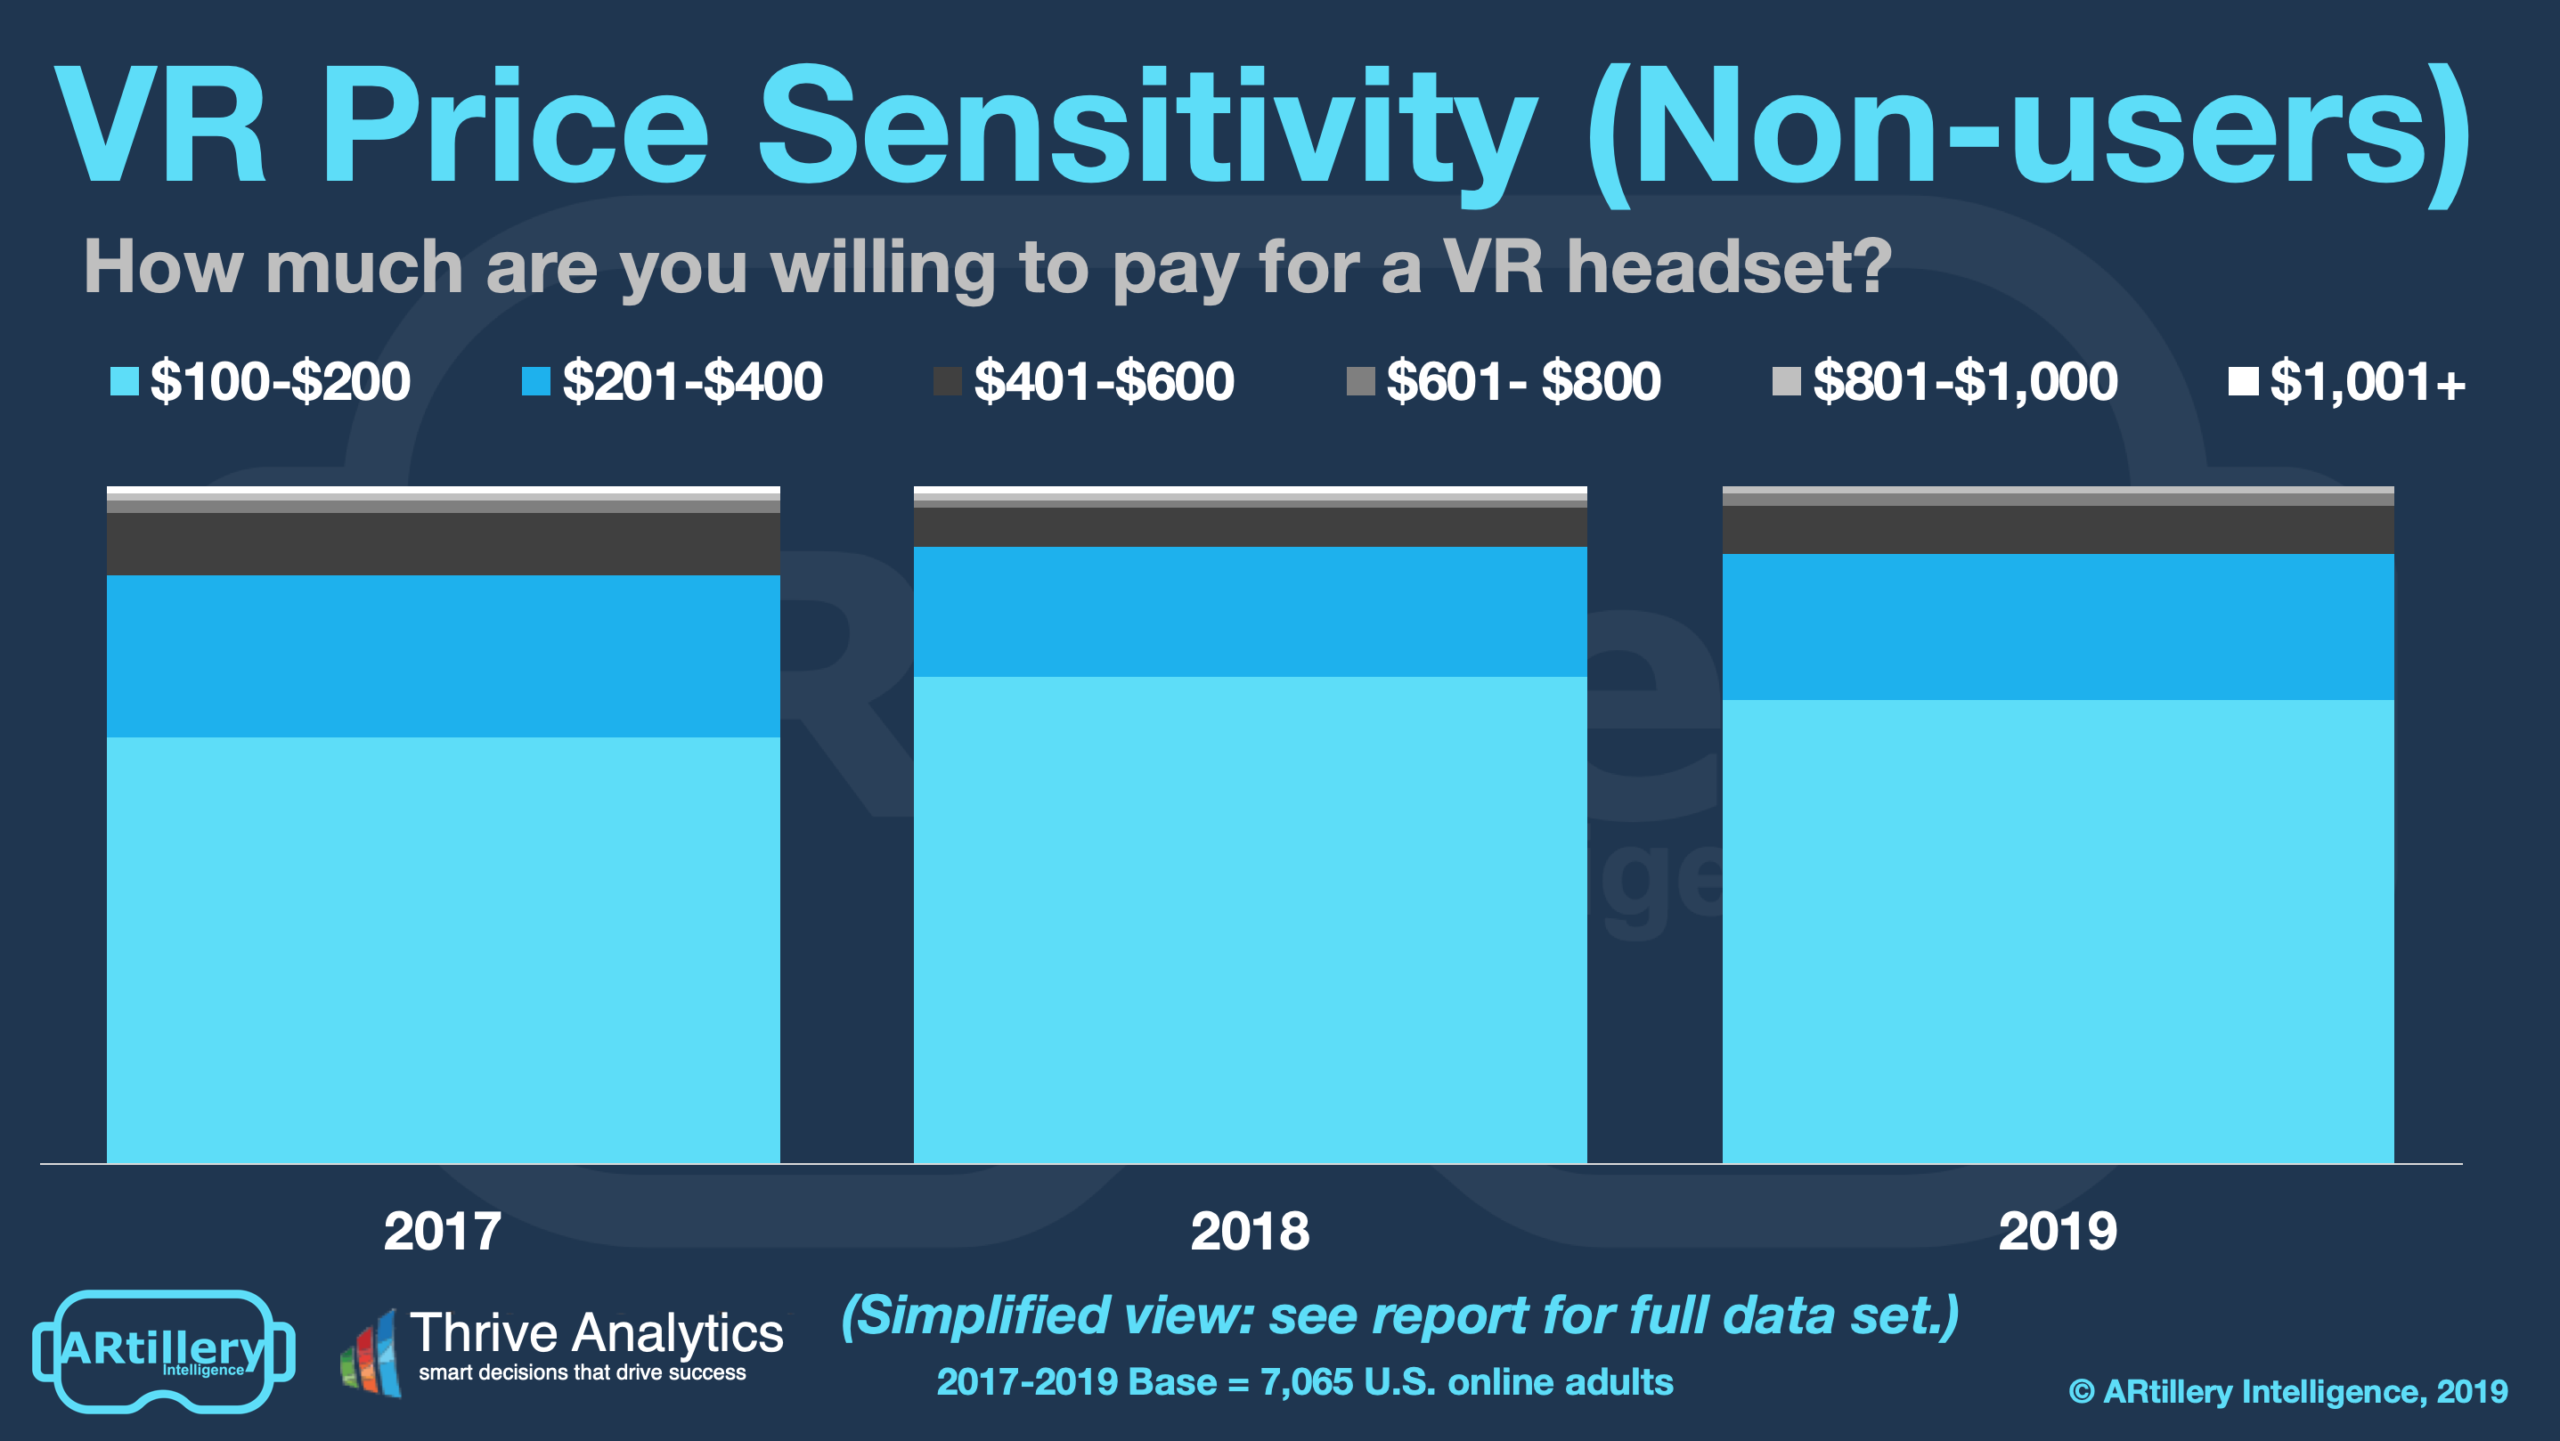
When looking at the same price equation for non-users, it’s a different story. Given their ambivalence towards VR, their price sensitivity is not-surprisingly greater than current VR users. The most popular pricing tier among this group was by far the lowest one, $100-$200 (69%).
When looking towards higher price points, such as anything over $600, only 3 percent of non-users reported willingness to buy. At the $1001+ level, zero respondents did so. As for trending, these figures remain mostly flat from 2018 with only slight deviations outside the margin of error.
One takeaway is that such resounding sentiment towards the sub-$200 level means that success in selling to this group lies with Oculus Go. There are others in this price range but Go shines with cinematic content (2D cinema in a 3D environment), where consumers express interest.
But going back to our earlier profiling of “potential buyers” (a subset of non-users), they indicated greater interest in paying up to $400 (45%). That compares with this full sample of non-users, 22 percent of whom would pay that much. Altogether this bodes well for both Oculus Quest and Go.
In other words, “potential buyers” (non-users who indicated interest in VR) are willing to pay Oculus Quest’s price. The rest of non-users are still potential, but less likely, VR converts. And for them, Oculus Go is in their price range. So collectively, Oculus has non-users well covered.
Cross Section
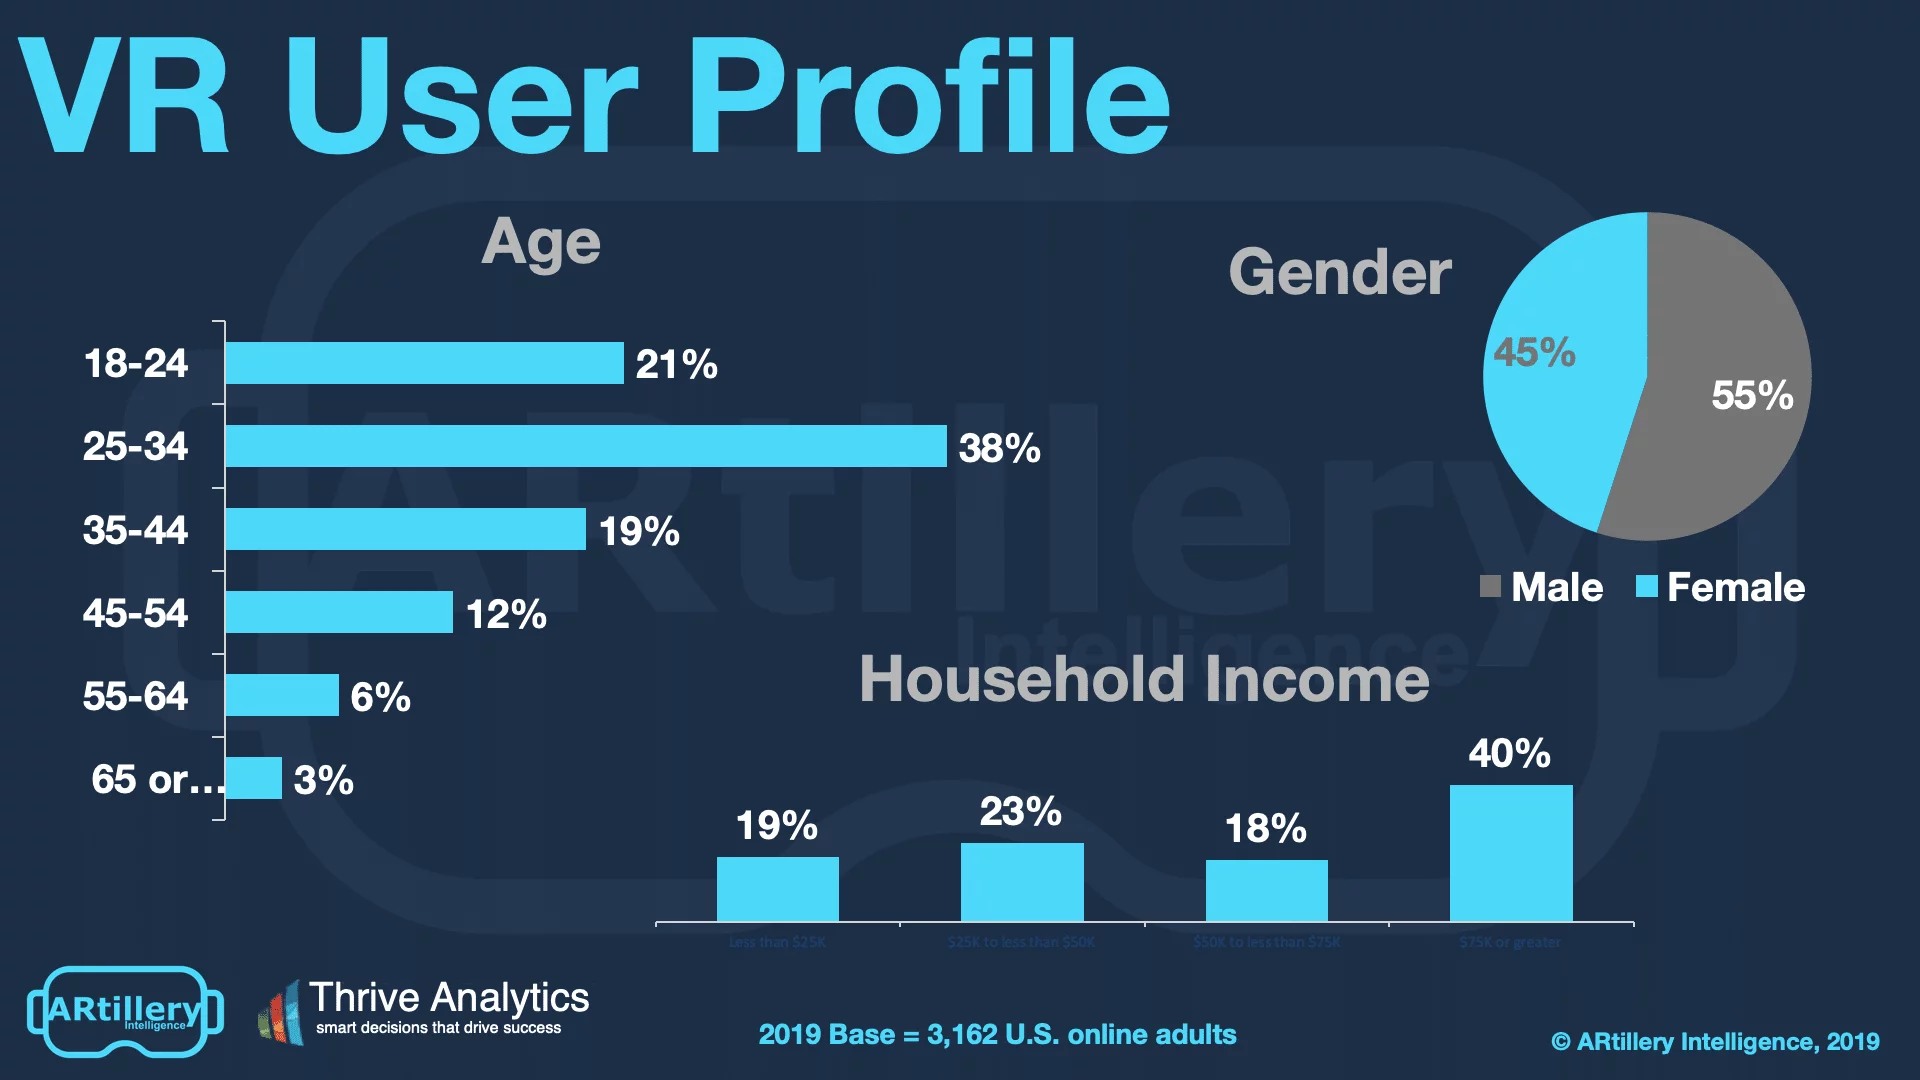
To add context to survey findings throughout this report, who’s answering the questions? It includes more than 3,100 U.S. adults. Going deeper into demographics and psychographics, the respondents break down as shown below. More detail and segmentation are available on request.
The survey sample spans a wide range of U.S. adult consumers. Gender breaks down fairly evenly, while age and income levels skew towards more attractive demographic groups. That includes active and buying-empowered age groups (25-34), and high-income homes ($75K+).
See more details about this report or continue reading here.
For deeper XR data and intelligence, join ARtillery PRO and subscribe to the free AR Insider Weekly newsletter.
Disclosure: AR Insider has no financial stake in the companies mentioned in this post, nor received payment for its production. Disclosure and ethics policy can be seen here.