
“Behind the Numbers” is AR Insider’s series that examines strategic takeaways from the original data of its research arm, ARtillery Intelligence. Each post drills down on one topic or chart. Subscribe or login to access the full library of data and reports.
How do consumers feel about VR? Who’s using it? What devices and apps do they prefer? And what do they want to see next? Similarly, what are non-users’ reasons for disinterest? And how can VR software developers and hardware players optimize product strategies accordingly?
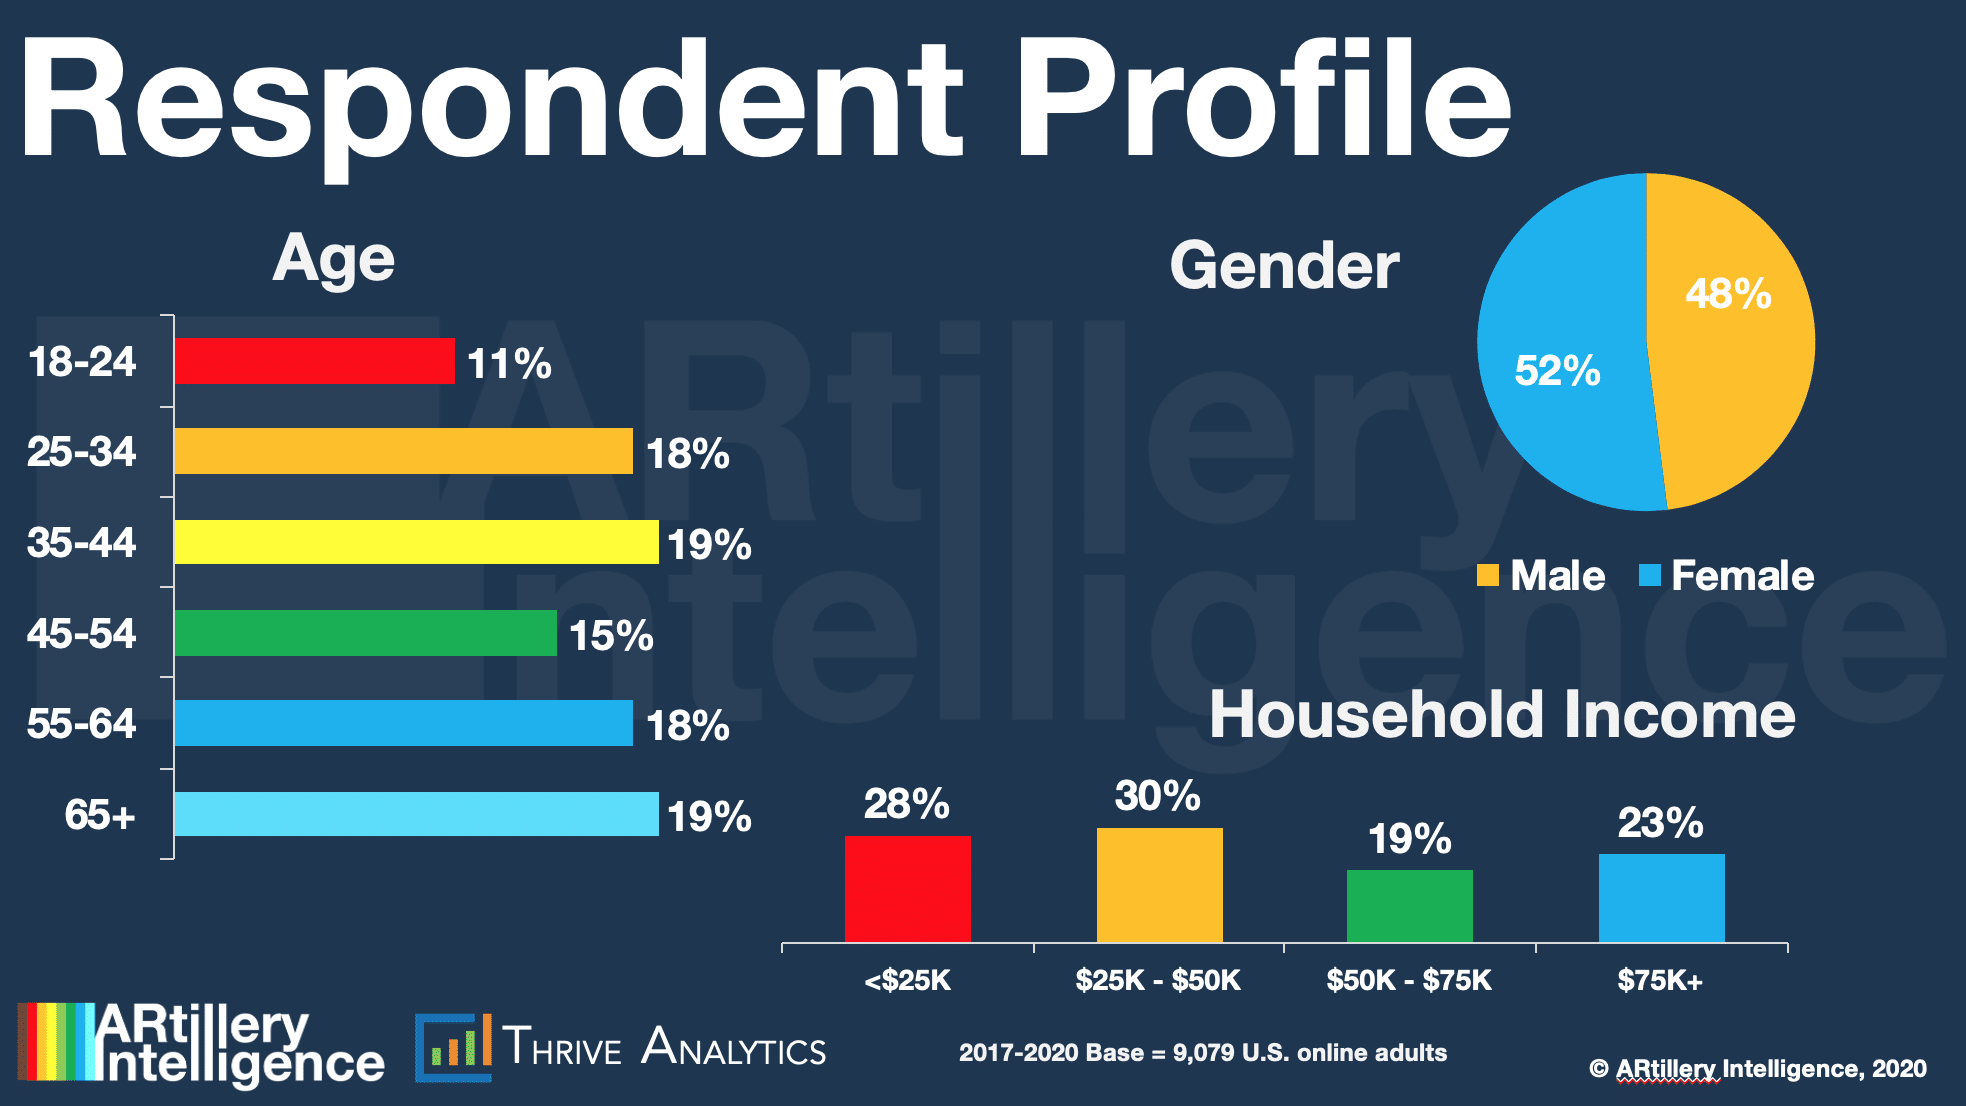
These are key questions at VR’s early stages. Working closely with Thrive Analytics, AR Insider’s research arm ARtillery Intelligence wrote questions to be presented to more than 1,000 U.S. adults in Thrive’s established consumer survey engine. And the result is a new narrative report.
Known as VR Usage & Consumer Attitudes, Wave IV, it follows similar reports over the last several years. Four waves of research now brings new insights and trend data to light. And all four waves represent a collective base of 9,079 U.S. adults for robust longitudinal analysis.
So what did they find out? At a high level, 19 percent of consumers surveyed have bought or used a VR headset, up from 16 percent in 2019. VR users also indicate high satisfaction; upward-trending usage frequency; and price sensitivity that aligns with current pricing trends.
The Competitive Field
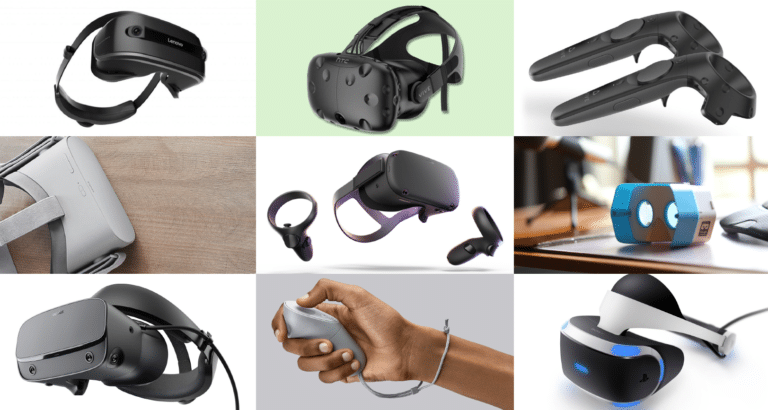
Going one level deeper, what devices are gaining the most traction? Samsung’s Gear VR scored highest at 48 percent. This is surprising due to the device’s market retreat throughout 2019 and 2020. So results are likely due to headsets still in-market (versus new sales) as an installed base.
Gear VR however is trending downward as expected. We project this to continue into further waves, as standalone headsets take over mobile VR’s fading position. We believe this will be led in future waves by Oculus Quest, VIVE Focus, and other standalone headsets that enter.
Speaking of Oculus Quest, it performed well but lower than expected, with 13 percent usage among respondents. On the bright side, it reached that point from zero percent, eight months before this survey was fielded. We expect it to grow significantly in the next wave.
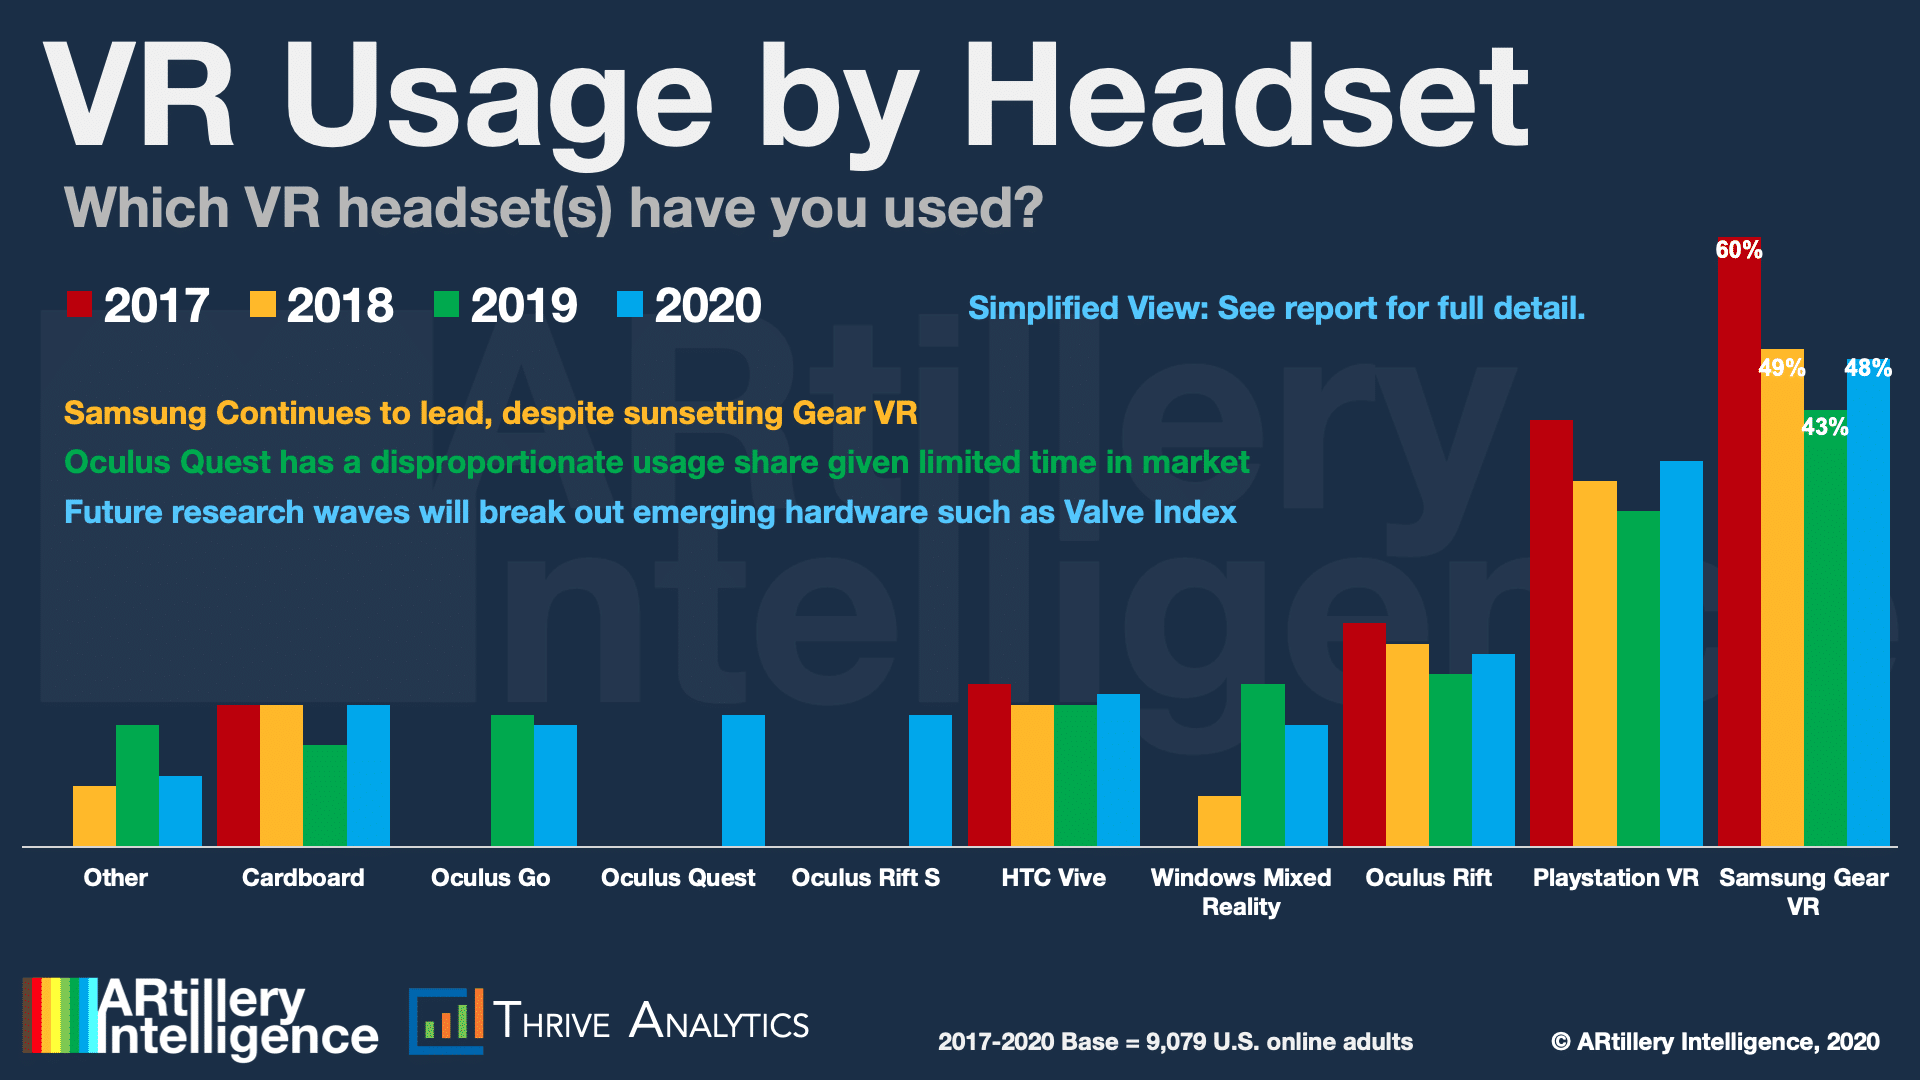
Playstation VR (PSVR) scored second-highest in adoption at 38 percent. This makes it the most adopted among tier-1 (tethered) headsets. This isn’t surprising, given an installed base of 100 million compatible PSVR consoles, and our separate sales tracking and market share estimates.
Oculus Rift, Windows Mixed Reality and HTC VIVE (all variants) had the third, fourth and fifth-highest penetration. They scored lower than PSVR despite better specs. The takeaway: ease of setup and “all-in” pricing (PSVR’s main benefits) outsell specs like processing and resolution.
A Fragmented Market
To define the term “all-in pricing,” used above, it means that additional hardware isn’t needed, such as gaming PCs to render high-end graphics for tethered headsets like Rift S and VIVE. Price is a key variable in unproven product classes like VR, which we explore later in this report.
Panning back, it’s evident that the market continues to fragment. The players that ruled 2017 (PSVR, Rift, VIVE, Gear VR) are now challenged by a new cast of players like Oculus Quest and Vive Focus. These challengers look to hit a sweet spot between “all-in” price, quality and ease.
So far that sweet spot has been best achieved by Oculus Quest, which has been well received at under $400. This has a lot to do with Facebook’s investment in VR, and its willingness to sacrifice margins to gain market share — a move that’s pursuant to its long-term platform approach.
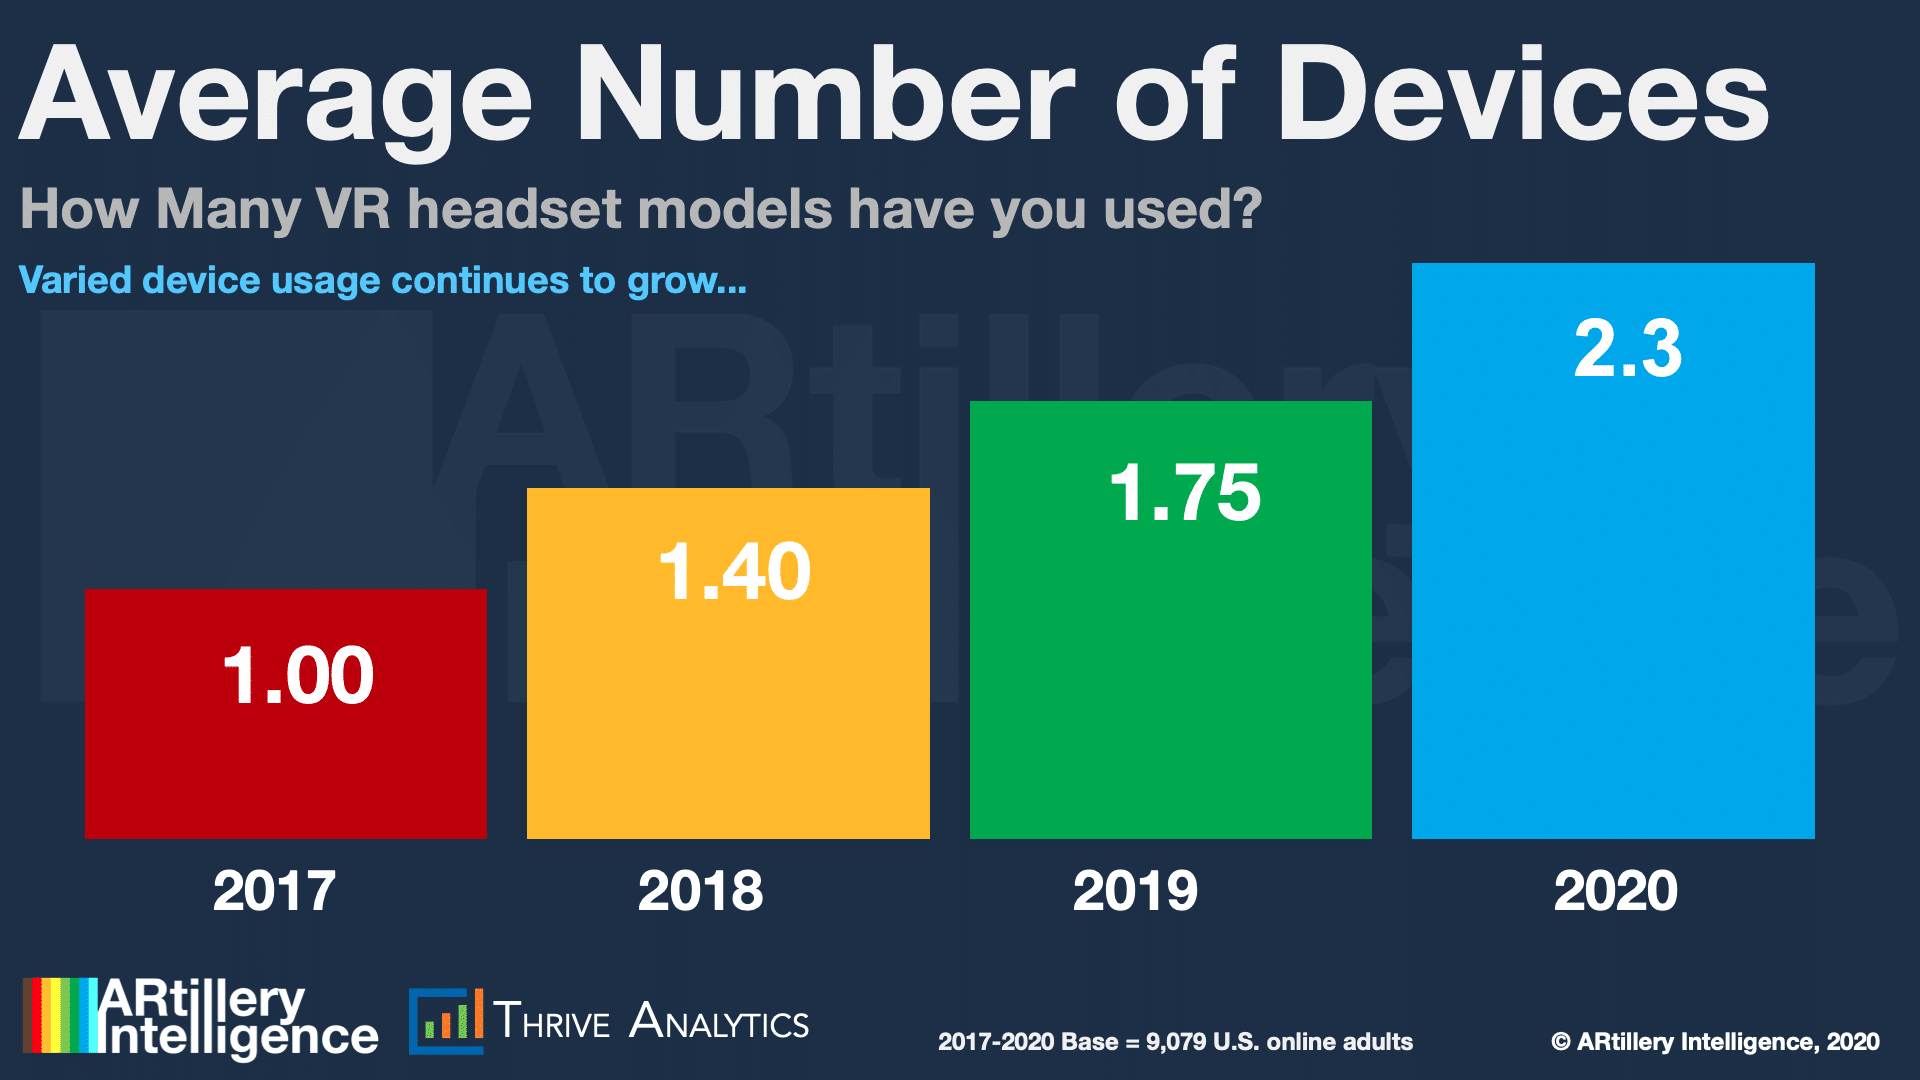
Meanwhile, fragmentation is making its mark. The average number of headsets users have tried continues to grow, now standing at 2.3. This is due to a combination of users’ comfort and savvy, the passage of time (cumulative headset use), and the quantity of in-market headsets.
We’ll be back with more report excerpts and tidbits. Meanwhile, check out the full report here.