
VR traction over the past few years has been slower than many had anticipated. But it’s still finding small wins and is growing at a fairly healthy pace. So the question is how well it’s landing with consumers today, and are those sentiments trending in the right direction?
So we set out for answers. Working closely with Thrive Analytics, ARtillery Intelligence authored questions to be fielded through its established survey engine to more than 98,000 U.S. adults. The result is Wave VI of the research, and a narrative report we published to unpack the results.
Known as VR Usage & Consumer Attitudes, Wave VI, it follows similar reports over the past few years. Five waves of research now bring new insights and trend data to light. And all five waves represent a collective six-digit sum of U.S. adults for robust longitudinal analysis.
Among the topics tackled: How is VR resonating with everyday consumers? How often are they using it? How satisfied are they? What types of experiences do they like most? How much are they willing to pay for it? And for those who aren’t interested in VR… why not?
Untethered Orientation
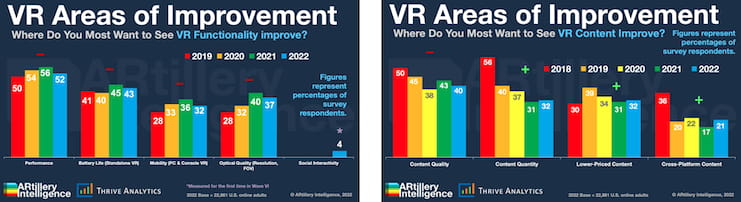
Building from the VR hardware sentiments explored in the last installment (what headsets have the best satisfaction?), we now move on to desired areas of improvement. Specifically, where do VR users want to see their VR experiences improve – in both hardware and software?
Mapping to that delineation in hardware versus software, we’ve split these survey results between feature-related factors and content-related factors. The former includes things like headset specs, speed, and comfort, while the latter includes things like content volume and quality.
Starting with features and functionality, overall performance leads, (52 percent), followed by battery life (43 percent), and optical quality (37 percent). These sentiments are driven by the rise of standalone headsets, where untethered orientation makes battery life a bigger factor.
Meanwhile, optical quality will be an ongoing area of improvement. This is a factor that’s inherently challenged because displays sit so close to your face, among other things. It’s also where Meta’s (widely panned) investments are pushing technical limits and accelerating VR.
Getting Better All the Time
Moving on to content-related factors, the top area for improvement is content quality (40 percent), followed by quantity (32 percent), price (32 percent), and cross-platform interoperability (21 percent). But more interesting than these Wave VI results is longitudinal trending.
For example, content quality has led the survey results since Wave 1 in 2018 (see above). However, that lead has declined over time. Specifically, 50 percent of respondents ranked this factor highest in 2018. But the decline in that metric over time is one sign that quality is improving.
The same goes for quantity: 2018 was a VR ghost town. That has changed as the VR installed base continues to grow and attract more developers. Meta has also sweetened the pot by signaling exit potential in its continued game studio acquisitions (albeit FTC-challenged).
Beyond acquisitions, there’s revenue incentive. Meta continues to emphasize game developer revenues, the most recent figures indicating that 132 Quest games have exceeded $1 million. This is a key accelerant pushing VR past its early-stage “chicken & egg” dilemma.
We’ll pause there and circle back in the next installment with more survey data. Meanwhile, see the full report here.