
Though spatial computing and all its subsegments continue to hold great potential, they also face headwinds. Factors holding them back include challenged technological advancement and cultural adoption. However, bright spots include the rise of AI-powered smart glasses.
For example, as seen in Meta’s earnings, smart glasses have offset declines in other subsegments, such as consumer VR. Altogether, it’s a mixed story with both positive and negative drivers. The good news is that the positives will mostly outweigh the negatives in the near term.
To wrap some numbers around these claims, spatial revenue is projected to grow from $28.5 billion in 2025 to $61.4 billion in 2030. That’s steep growth, driven by a projected inflection next year as new smart glasses blitz the market from Apple, Meta, Google (AndroidXR), and others.
What else is driving spatial revenues, and what are strategic implications? These questions are tackled in the latest spatial revenue forecast from our research arm, ARtillery Intelligence. This Behind the Numbers series excerpts those insights, continuing below with unit sales estimates.
Numbers Game
After the last installment of this series looked at XR estimates across its main subdivisions – such as form factors and enterprise/consumer divisions – we move on to unit sales projections. XR headsets are projected to grow in unit sales from 11.77 million in 2025 to 50.68 million in 2030.
That outer-year figure correlates to an installed base of 142 million units 2030. All the above figures include both consumer and enterprise-deployed hardware. Consumer device sales exceed that of enterprises, with 9.83 million estimated in 2025, growing to 45.79 in 2030.
Why have consumer XR device sales eclipsed enterprise sales? In previous years, it was mostly due to VR, where consumer markets see higher device sales. But its lead is now being driven by smart glasses, which are already showing ample momentum today and will accelerate quickly.
But the bigger question is why such steep growth for device sales? It’s driven by all that momentum around smart glasses – both display and non-display variants. There’s a projected inflection in 2027 as noted earlier, following launches from Apple, Samsung, and others.
That inflection could be meaningful but only to a point. Sales could decelerate into 2028 as a market saturation point is reached. In other words, supply could meet AR’s demand ceiling as all these devices blitz the market. This sequence over a few years will represent a classic S-curve.
Categories & Classifications
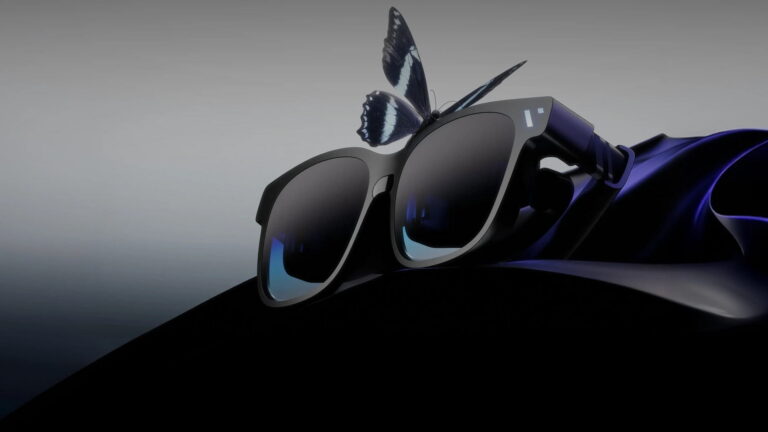
Breaking down device categories that are driving all that growth, Ray-Ban Meta Smart glasses (non-display) are gaining traction at a scale not yet seen in XR, to the tune of 10 million+ lifetime units. We’re also seeing demand for display glasses, including video and utility glasses.
Starting with the former, video display glasses include the likes of VITURE and XREAL. They offer a simple and attractive value proposition for large private screens on which to view familiar and already-owned content (e.g., streaming apps, gaming), mirrored from USB-C devices.
As for utility display glasses, they include the likes of Meta Ray-Ban Display Glasses and Even Realities G2. These mark a trend towards visually toned-down AR that prioritizes style and utility over dimensional visuals. Others will include Apple, Samsung, and those built on Android XR.
But though these flat AR formats are the most active, dimensional AR hasn’t gone away. The previous generation’s flagships have receded – such as Microsoft HoloLens – but from those ashes sprouts a new breed of dimensional AR such as Snap’s upcoming consumer Specs.
Altogether, the XR market will offer ample optionality. In addition to the above formats – where the momentum is seen today – there’s also mixed reality headsets like Quest 3 and Apple Vision Pro. In total, the XR device spectrum is diverging and diversifying with purpose-built hardware.
We’ll pause there and circle back in the next Behind the Numbers installment with more numbers & narratives. Meanwhile, check out the full report.