

This post is adapted from ARtillery Intelligence’s latest report, Mobile AR Usage & Consumer Attitudes. It includes some of its data and takeaways. More can be previewed here and subscribe for the full report.
How do consumers feel about mobile AR? Who’s using it? How often? And what do they want to see next? More importantly, what are non-users’ reasons for disinterest? And how can app developers and anyone else building mobile AR apps optimize product strategies accordingly?
These are questions we set out to answer. Working with Thrive Analytics, ARtillery Intelligence wrote questions to be presented to more than 3000 U.S. adults. The results are in and analyzed in the latest ARtillery Intelligence report. Today we dive into consumers’ price sensitivity.

How Much?
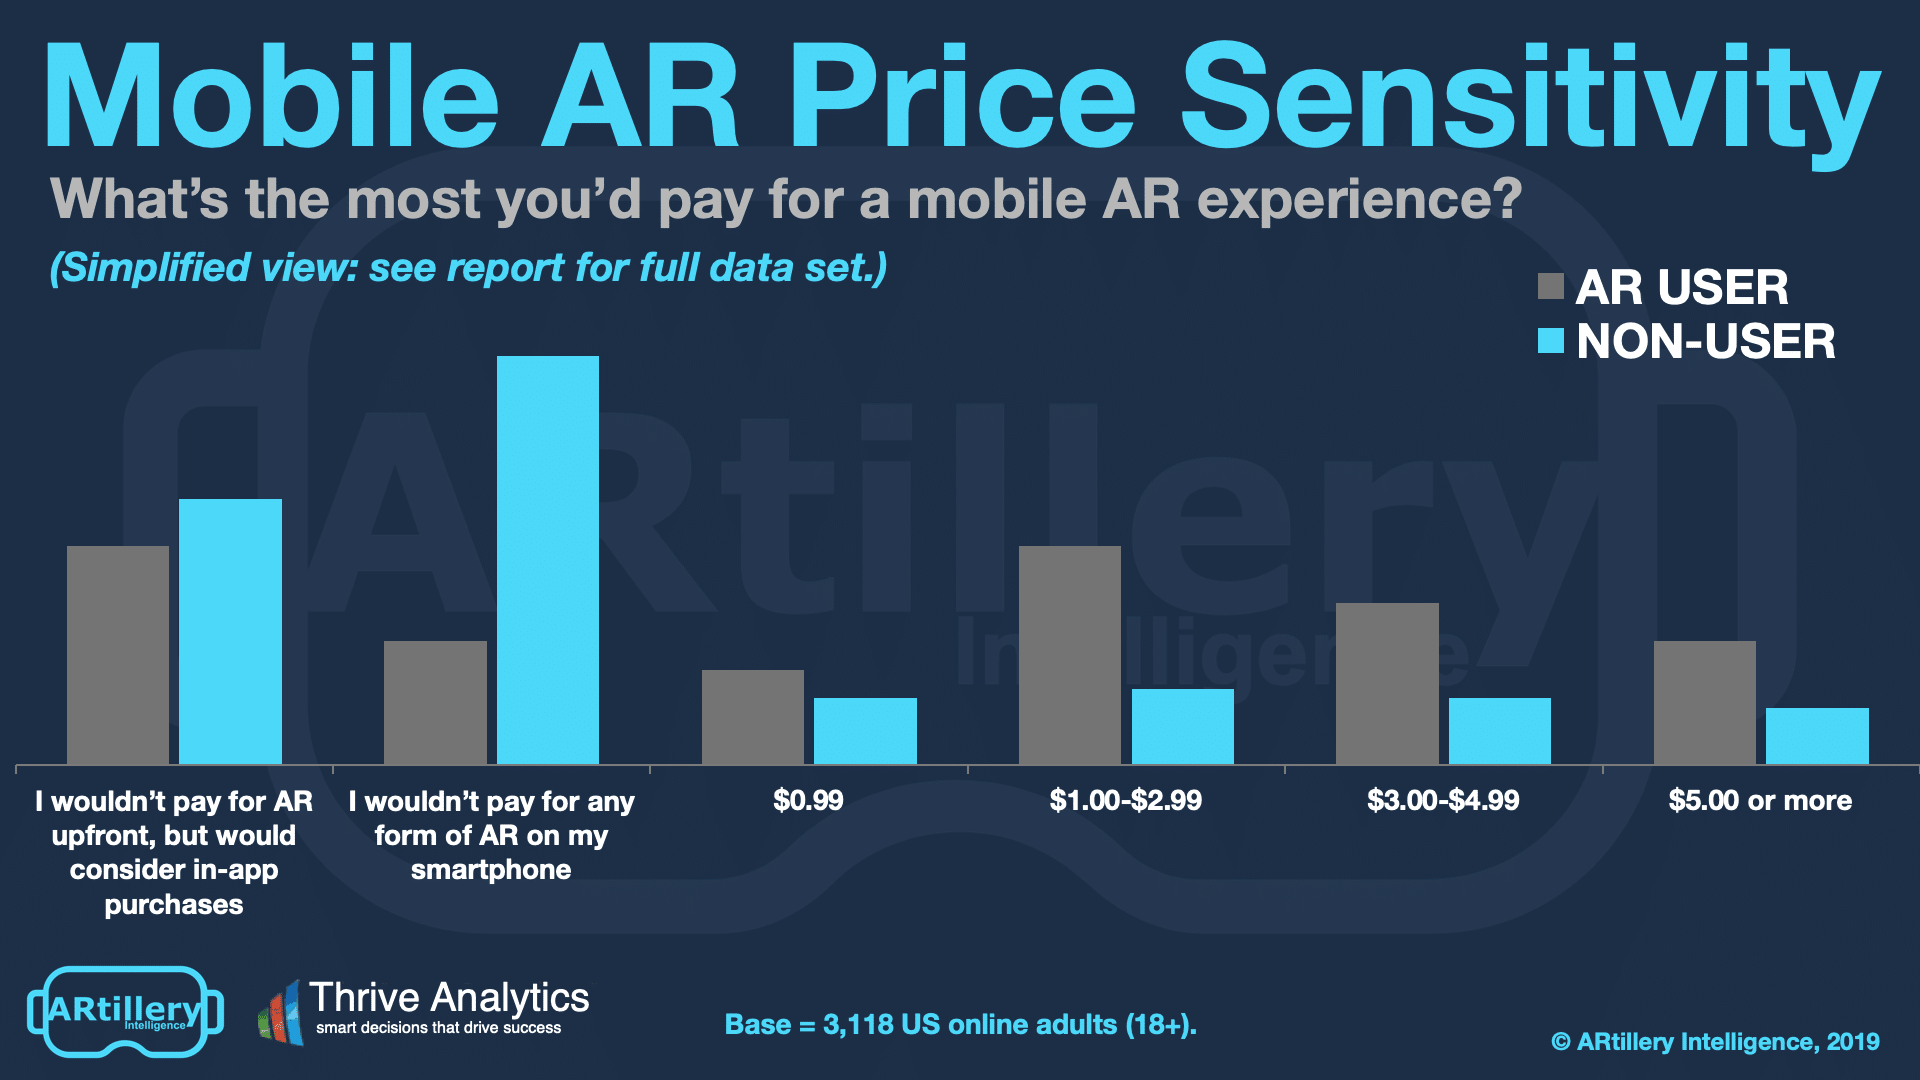
Picking up where we left off in examining AR users’ satisfaction, how much are they willing to pay for mobile AR experiences? It varies for mobile AR users and non-users. Starting with users, 53 percent will pay $1.00 or more for AR apps. And 13 percent will pay more than $5.00.
This is a strong demand signal, considering greater price sensitivity in the broader universe of mobile apps. We attribute this higher willingness to pay for mobile AR to their satisfaction rankings. High satisfaction with AR logically correlates to more willingness to spend.
Further delineating AR users’ cost sentiments, the “magic price” seems to be between $1.00 and $3.00. In fact, 23 percent of users indicated interest at this price point, a statistically significant increase from other price thresholds. Only in-app purchases scored higher (more on that in a bit).
Meanwhile, non-users sing a different tune for price sensitivity. Only 21 percent will pay $1.00 or more for mobile AR apps. More worrisome is that the greatest share of responses (43 percent) is unwilling to pay any amount for mobile AR. These users align with the “just not interested” crowd.
However, one positive signal from non-users is that 28 percent would consider in-app purchases after having downloaded a free app. Along with the current-user responses, this indicates that in-app purchases should be considered to address the largest range of users and affinity groups.
IAP Pulls Ahead
Expanding a bit on in-app purchases (IAP), these data clearly support it. 23 percent of AR users report that they won’t pay upfront for mobile AR apps but will use IAP. This is a key finding that validates several other market signals we’ve separately examined around the IAP opportunity.
In short, several signs point to IAP as a prevailing revenue model for mobile AR. Besides the evidence seen in this survey, IAP is a purchase method in which consumers are already comfortable, given its prevalence in mobile gaming. It drives $156 billion in annual revenues.
In AR specifically, IAP likewise indicates traction. The AR revenue leader so far is Pokemon Go and majority of its revenue – to the tune of about $2.3 billion to date – is through IAP. Given price sensitivity to early/unproven technology, IAP lets users “ease into” the experience before paying.
In fact, IAP can be advantageous for several reasons. Average revenue per user is often greater than upfront app purchases, due to the behavioral economics of microtransactions and unit economics of recurring revenue. It depends on the app, but IAP should always be considered.
This is especially so in gaming and social AR. Conversely, signals indicate that IAP isn’t as effective in media and information experiences. That’s where consumers have been conditioned for subscription or ad-supported experiences. The latter is likely how visual search will monetize.
Cross Section
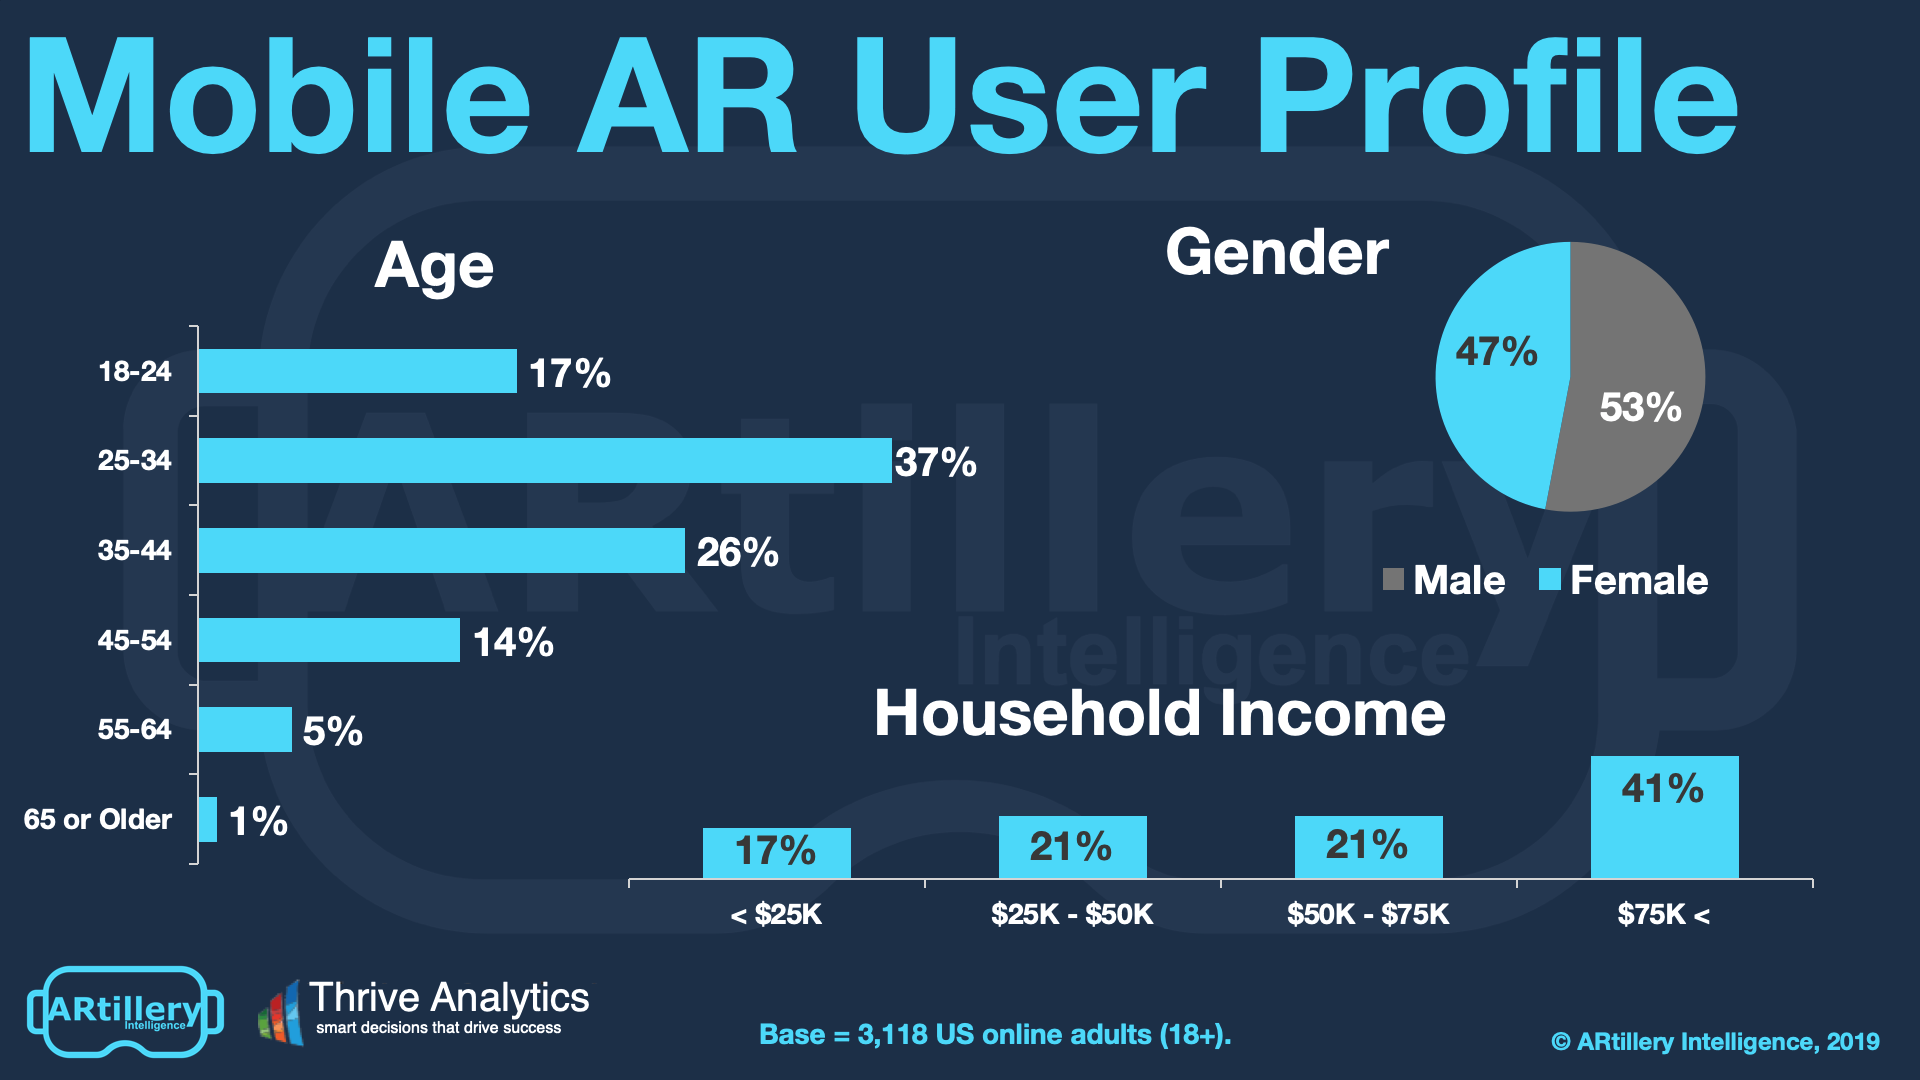
To add context to survey findings throughout this report, who’s answering the questions? It includes more than 3000 U.S. adults. Going deeper into demographics and psychographics, AR users break down as shown above.
As the data show, the segment of AR users spans a wide range of U.S. adult consumers. Gender breaks down fairly evenly, while age and income levels skew towards attractive demographic groups. That includes buying-empowered age groups (25-34), and high-income homes ($75K+).
See more details about this report or continue reading here.
For deeper XR data and intelligence, join ARtillery PRO and subscribe to the free AR Insider Weekly newsletter.
Disclosure: AR Insider has no financial stake in the companies mentioned in this post, nor received payment for its production. Disclosure and ethics policy can be seen here.