

Data Point of the Week is AR Insider’s dive into the latest spatial computing figures. It includes data points, along with narrative insights and takeaways. For an indexed collection of data and reports, subscribe to ARtillery Pro.
Pokémon Go’s business case continues to be validated. Though the tech & media press corps has shifted the spotlight to other shiny things, the app continues to see strong user engagement and revenue. August was its biggest revenue month in three years, as we recently examined.
Equally notable, the app just crossed $3 billion in lifetime gross revenue in October according to Sensor Tower estimates. This follows the July estimate that the app had made $2.65 billion to date. If these figures are accurate, it puts Pokémon Go on an $840 million annual run rate.
To be clear, this isn’t first-party data from Niantic, but Sensor Tower’s extrapolated figures (and our run-rate calculation). Sensor Tower is arguably reliable in its network reach (sample size), and a consistent methodology over time also enables longitudinal analysis for revenue growth.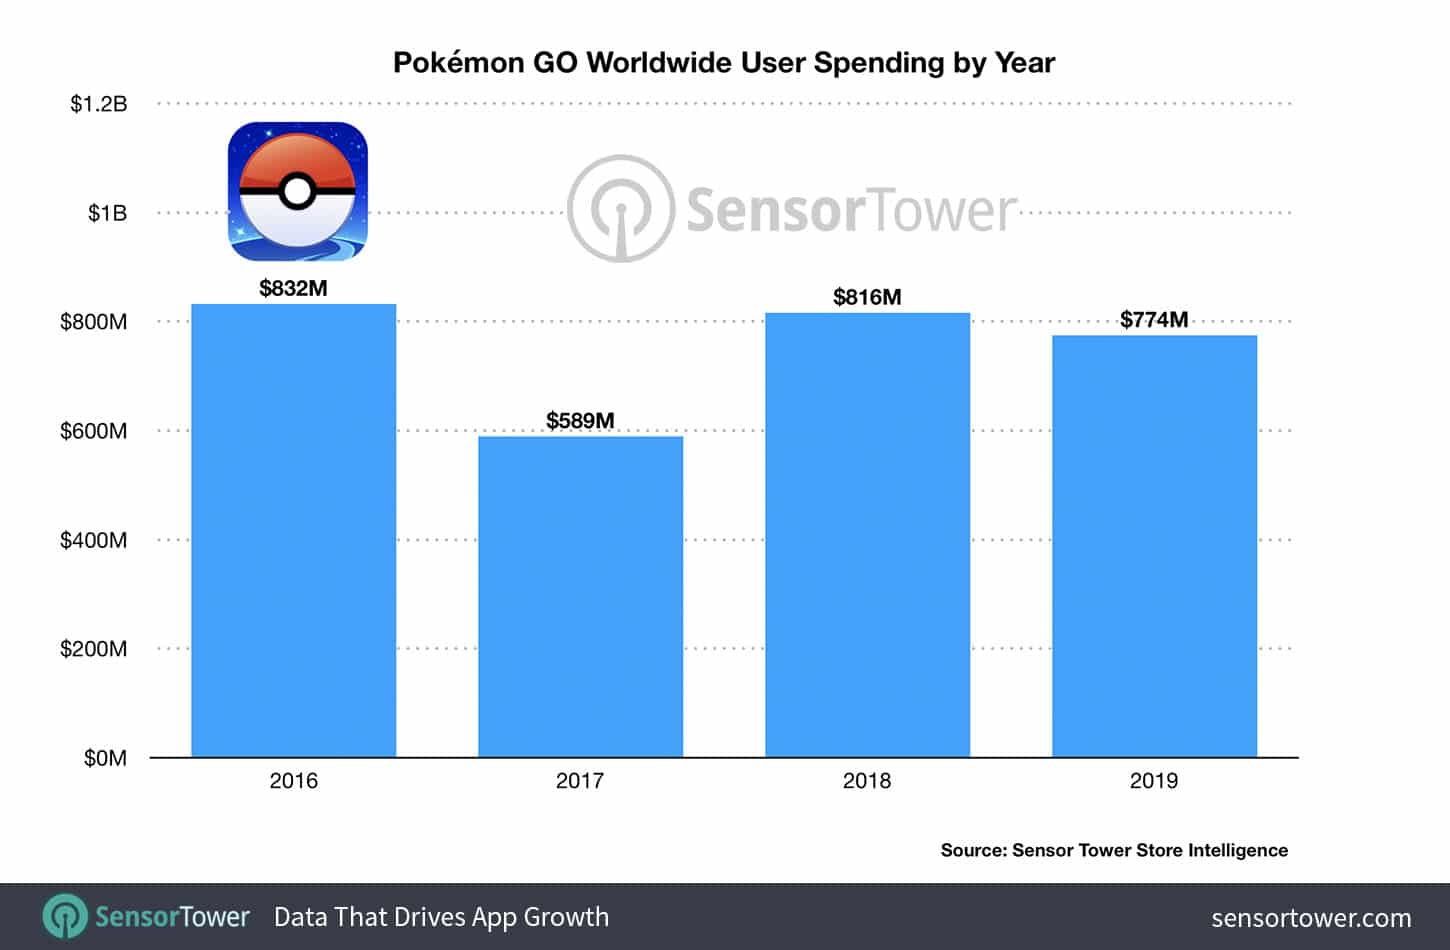
Business Model Validation
On that note, Sensor Tower estimates $832.4 million in 2016 revenues, dipping to $589.3 million in 2017 before rebounding to $816.3 million in 2018 and $774.3 million so far this year. That puts it on pace for its largest revenue year to date in 2019, and congruent with the above run rate.
It should be noted that though 2016 revenues are lower than 2019’s likely total, the game was launched in July of that year. That means 2016 revenue was achieved over a smaller period of July-December, so its revenue run rate during that time remains the highest in its history.
Cumulative app downloads meanwhile total 541 million, making the average revenue per user about $5.60. This ARPU notably increased over time as usage declined while Niantic found ways to better monetize the experience, including this year’s incorporation of Team Rocket.
Altogether, this further validates Pokémon Go’s in-app purchases (IAP) revenue model. It’s inherited from the broader mobile gaming world, where it approaches $70 billion in annual revenue on the behavioral economics of microtransactions (all that money you spend on Candy Crush).
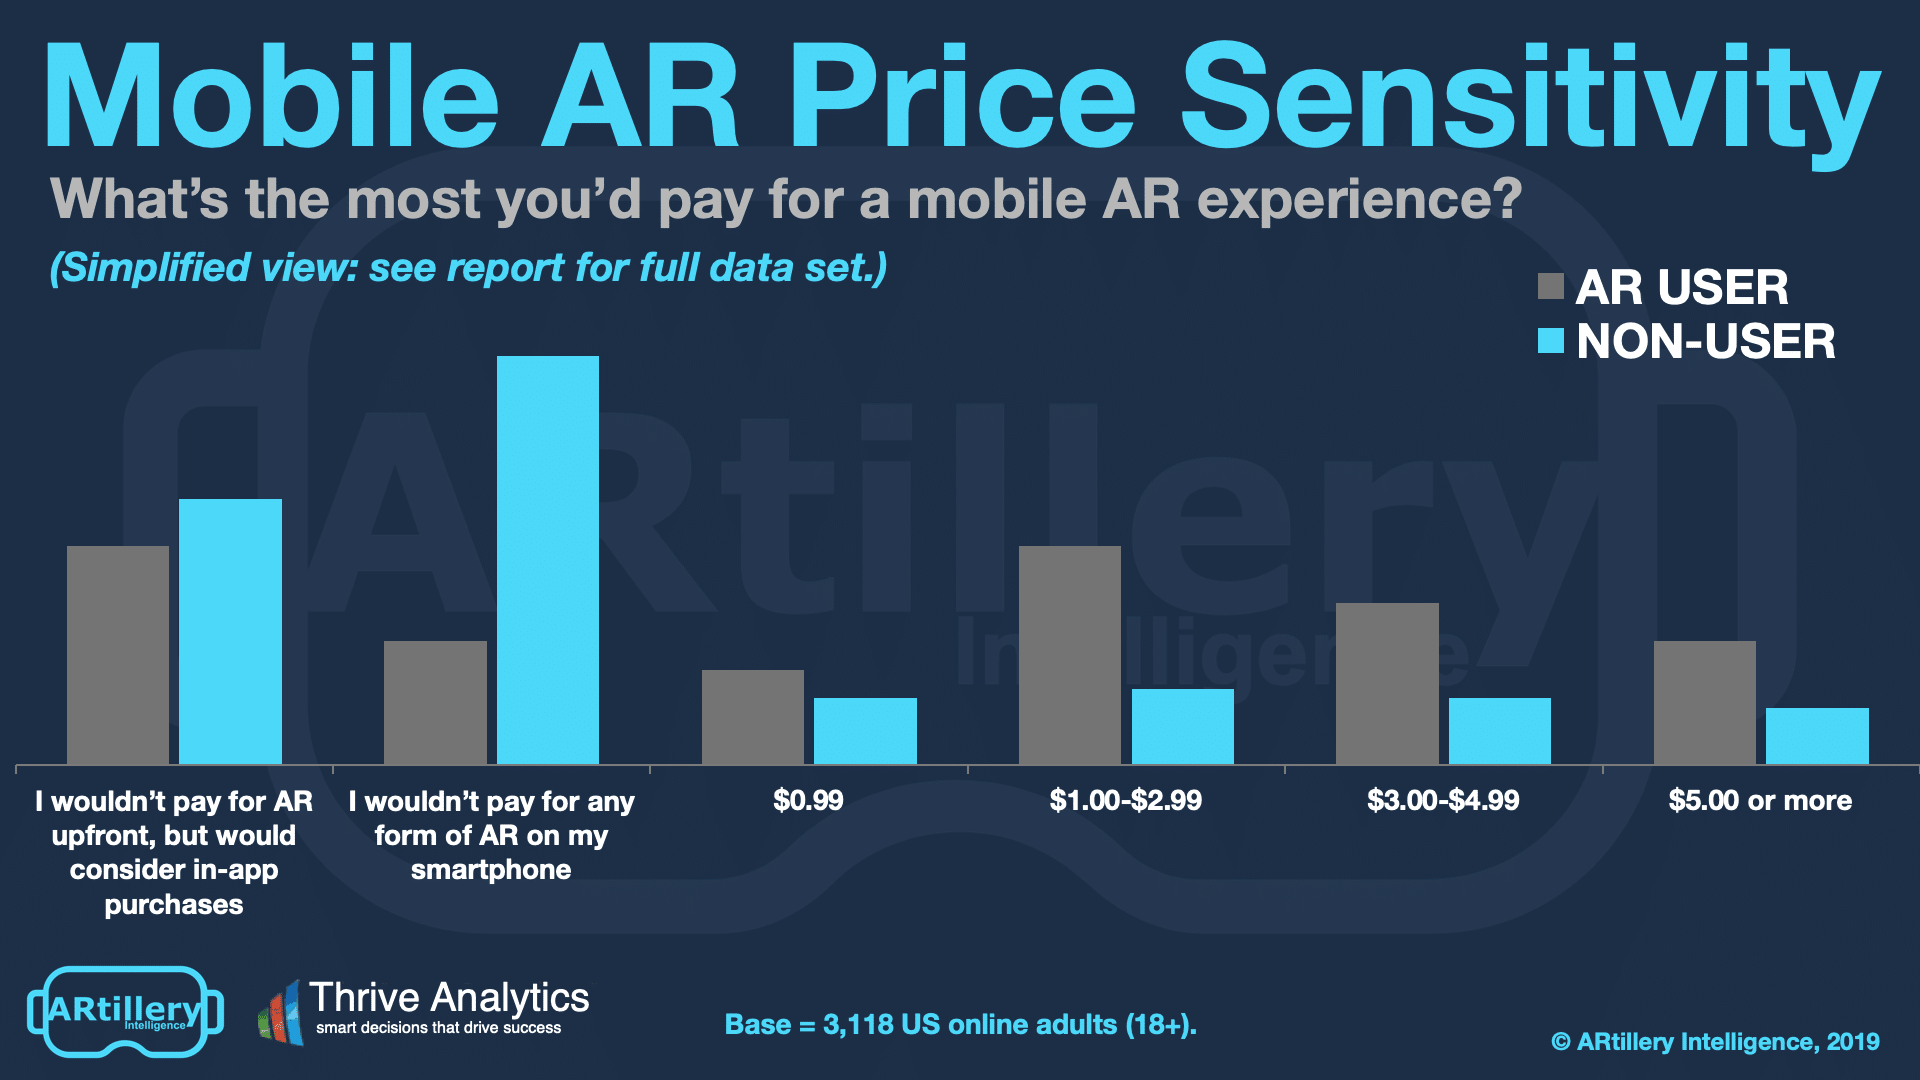
Not only is IAP validated in mobile gaming but it’s fitting to AR’s early stage when users hesitate to pay upfront for premium apps. Beyond revenues, IAP is supported by consumer survey data from our research arm ARtillery Intelligence, and recent report on top AR business models.
Demand Signals
But as always, growth rates are harder to maintain as revenue escalates and period-over-period growth is calculated from a larger denominator. This compels revenue diversification and adjacent products that boost variable revenue against fixed cost (one way to grow operating margin).
This is precisely what Niantic recently did by expanding the capacity of its secondary revenue stream for in-game brand sponsorship. Previously available to multi-location brands like McDonald’s and Starbucks, it will now tap into the long-tail SMB marketplace.
The question is if this will indeed allow Niantic to maintain growth rates as the core IAP revenue stream matures. It can also maintain IAP growth through other means like geographic expansion (U.S. currently leads revenue) and more ARPU-boosting features like those mentioned above.
This will be worth watching, as early industry leaders like Niantic do the industry a favor through the large-scale deployment. That can uncover key market dynamics and demand signals which is valuable intelligence in early stages of any consumer technology. We’ll be watching.
For deeper XR data and intelligence, join ARtillery PRO and subscribe to the free AR Insider Weekly newsletter.
Disclosure: AR Insider has no financial stake in the companies mentioned in this post, nor received payment for its production. Disclosure and ethics policy can be seen here.
Header Image Credit: Niantic