
Data Point of the Week is AR Insider’s dive into the latest spatial computing figures. It includes data points, along with narrative insights and takeaways. For an indexed collection of data and reports, subscribe to ARtillery Pro.
How did funding in the AR sector fare in 2019? This is a common data point measured by investment banks, research firms and VCs. The lasted figures are in from venerable AR news source NextReality, which counts $1.19 billion for the top 10 AR funding rounds of 2019*
Beyond the top 10, NextReality expanded its list this year for the first time to the top 25 funding rounds (listed below). Adding those up gives us a total of $1.36 billion. This doesn’t represent total sector funding but is a good sample for directional observation and longitudinal analysis.
Speaking of which, other notable stats from its annual roundup include the following:
— The $1.19 billion aggregate for 2019’s top 10 is down from $2.26 in 2018 and $1.82 in 2017.
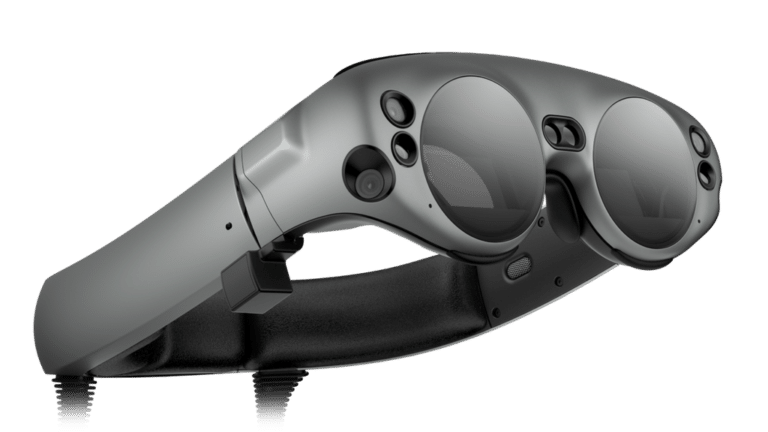
— Magic Leap, the top-funded company, raised $280 million compared to $1.25 billion in 2018 and $502 million in 2017
— The top three companies in 2019 were more tightly clustered than in past years, separated only by $10 million.
— There were some high-profile flameouts in 2019, including Meta, ODG and Daqri, while others exited below previous funding totals (a veritable down-round), including Leap Motion.
Some of these figures can be argued as incidental (clustering within the rankings), while others likely represent market factors that are very relevant (aggregate funding dip). Either way, the question this all raises is where is AR in its lifecycle as we enter 2020? And where is it headed?
Gravitational Pull
Whenever this question comes up, the go-to explanation is AR’s period of repentance in the “trough of disillusionment,” of Gartner’s Hype Cycle. This is a perfectly valid construct but it’s arguably overused in nearly every conference presentation these days on AR’s status.
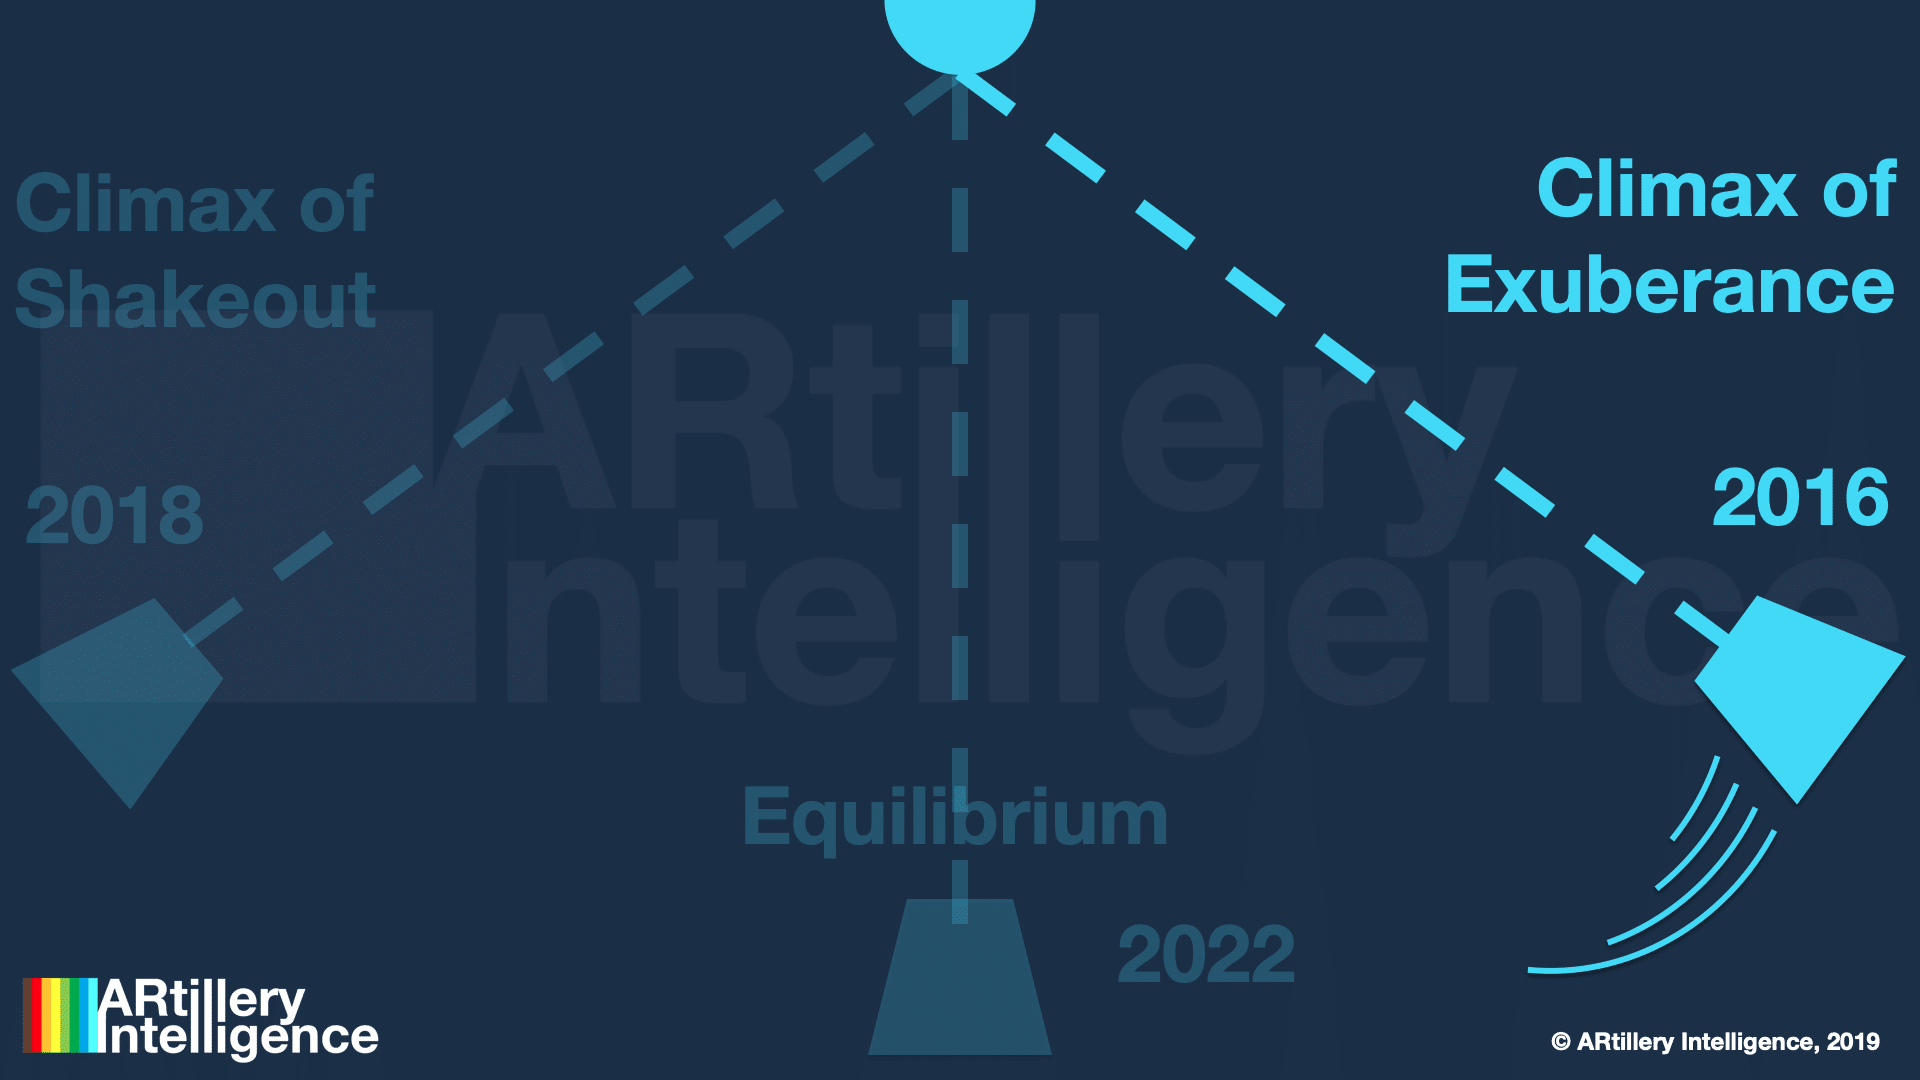
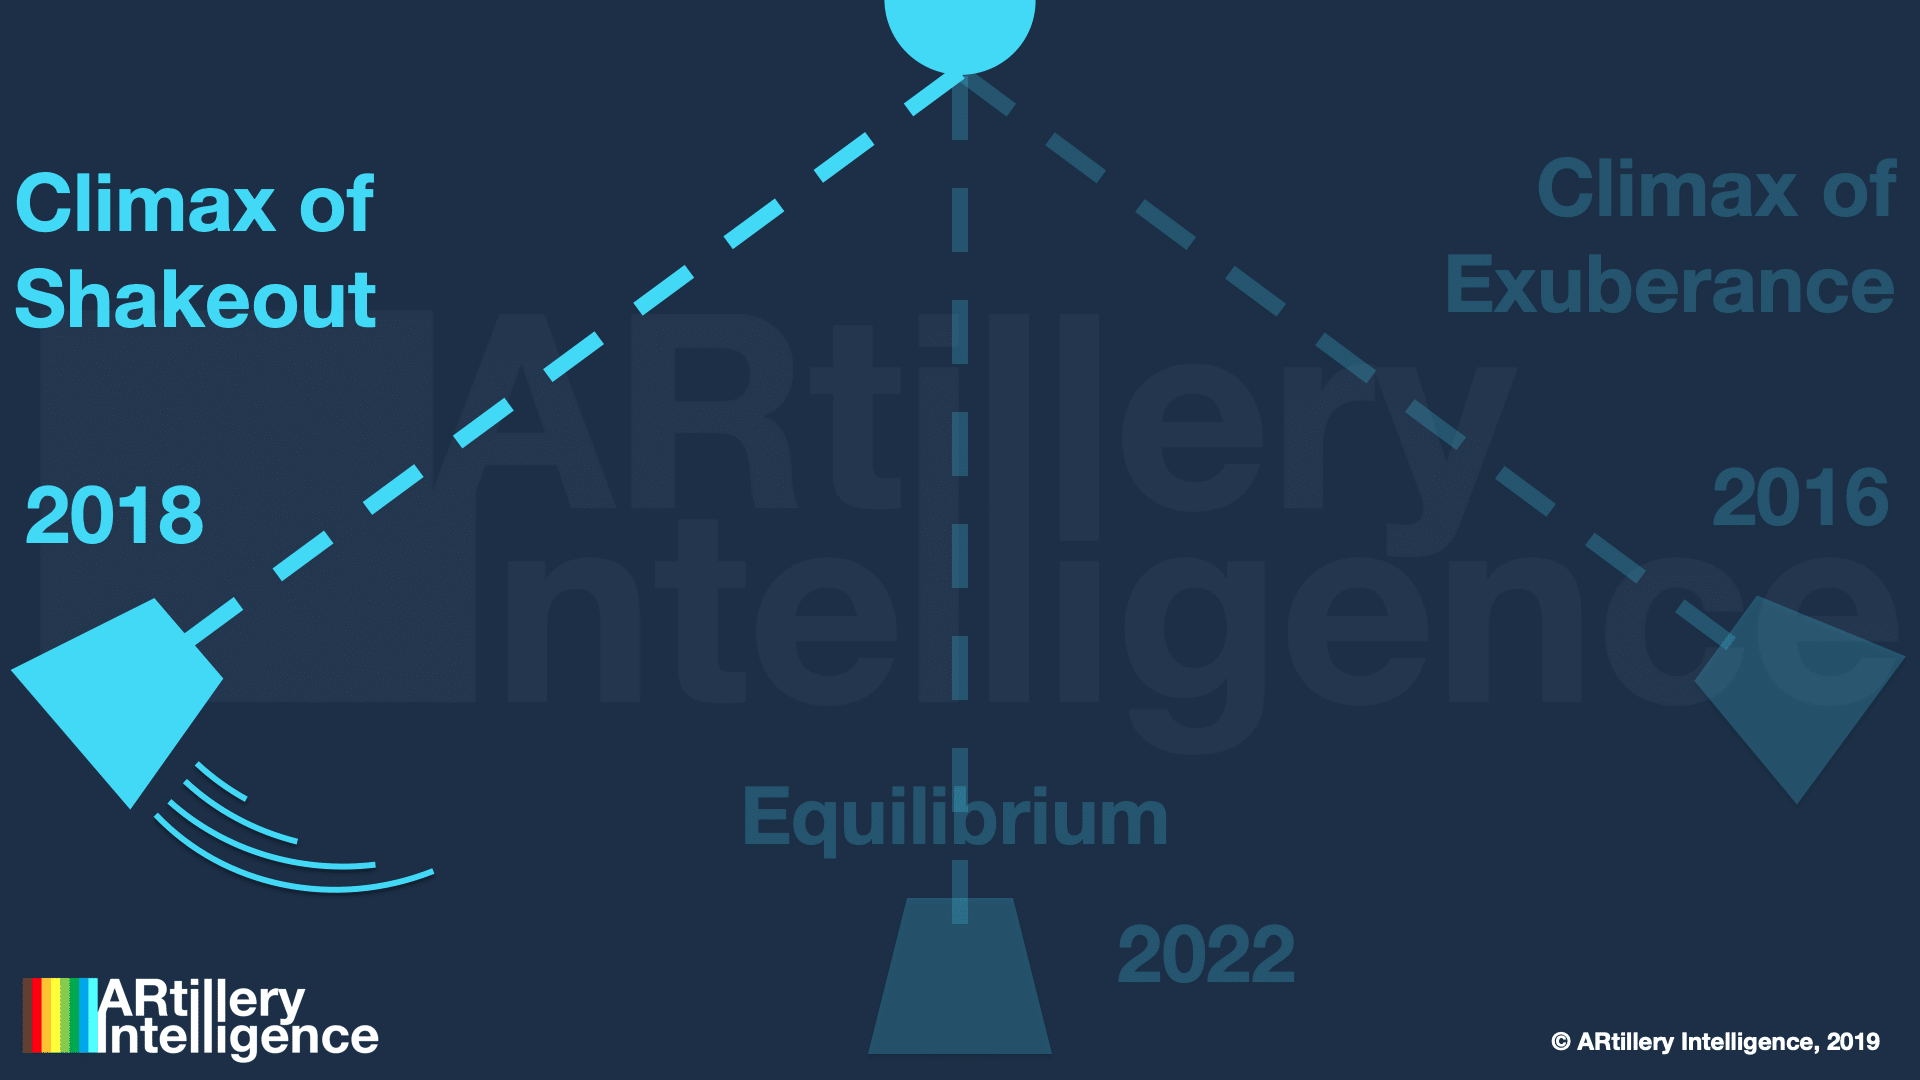
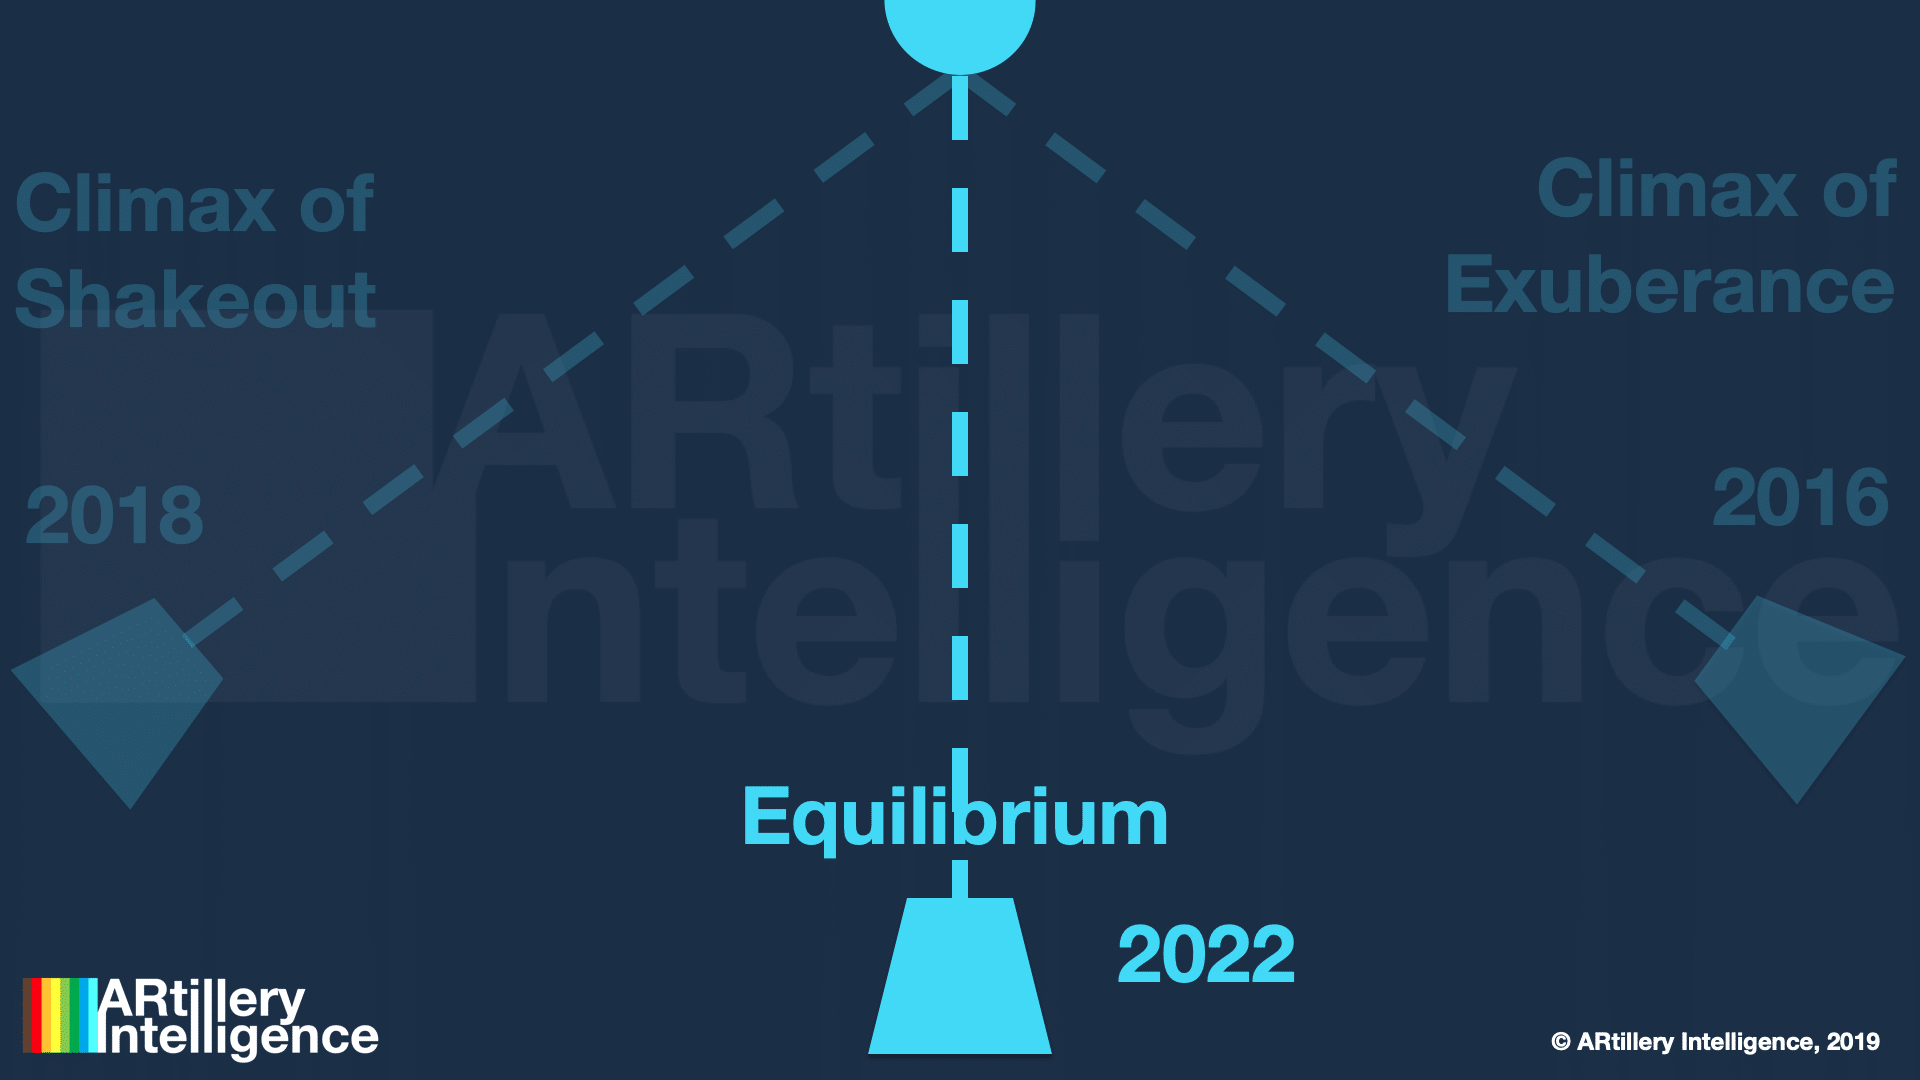
So we’ve begun to think about AR’s lifecycle using a different construct: that of a pendulum. Often in early-stage sectors, a pendulum metaphorically swings in one direction that represents overblown expectations, supply-side saturation and lots of venture funding (arguably too much).
Then, it swings in the other direction as a backlash to the exuberance. That period is defined by sobering realizations that the technology isn’t ready, or that it’s not gaining the traction previously expected. A shakeout ensues as venture funding pulls back and companies dissolve.
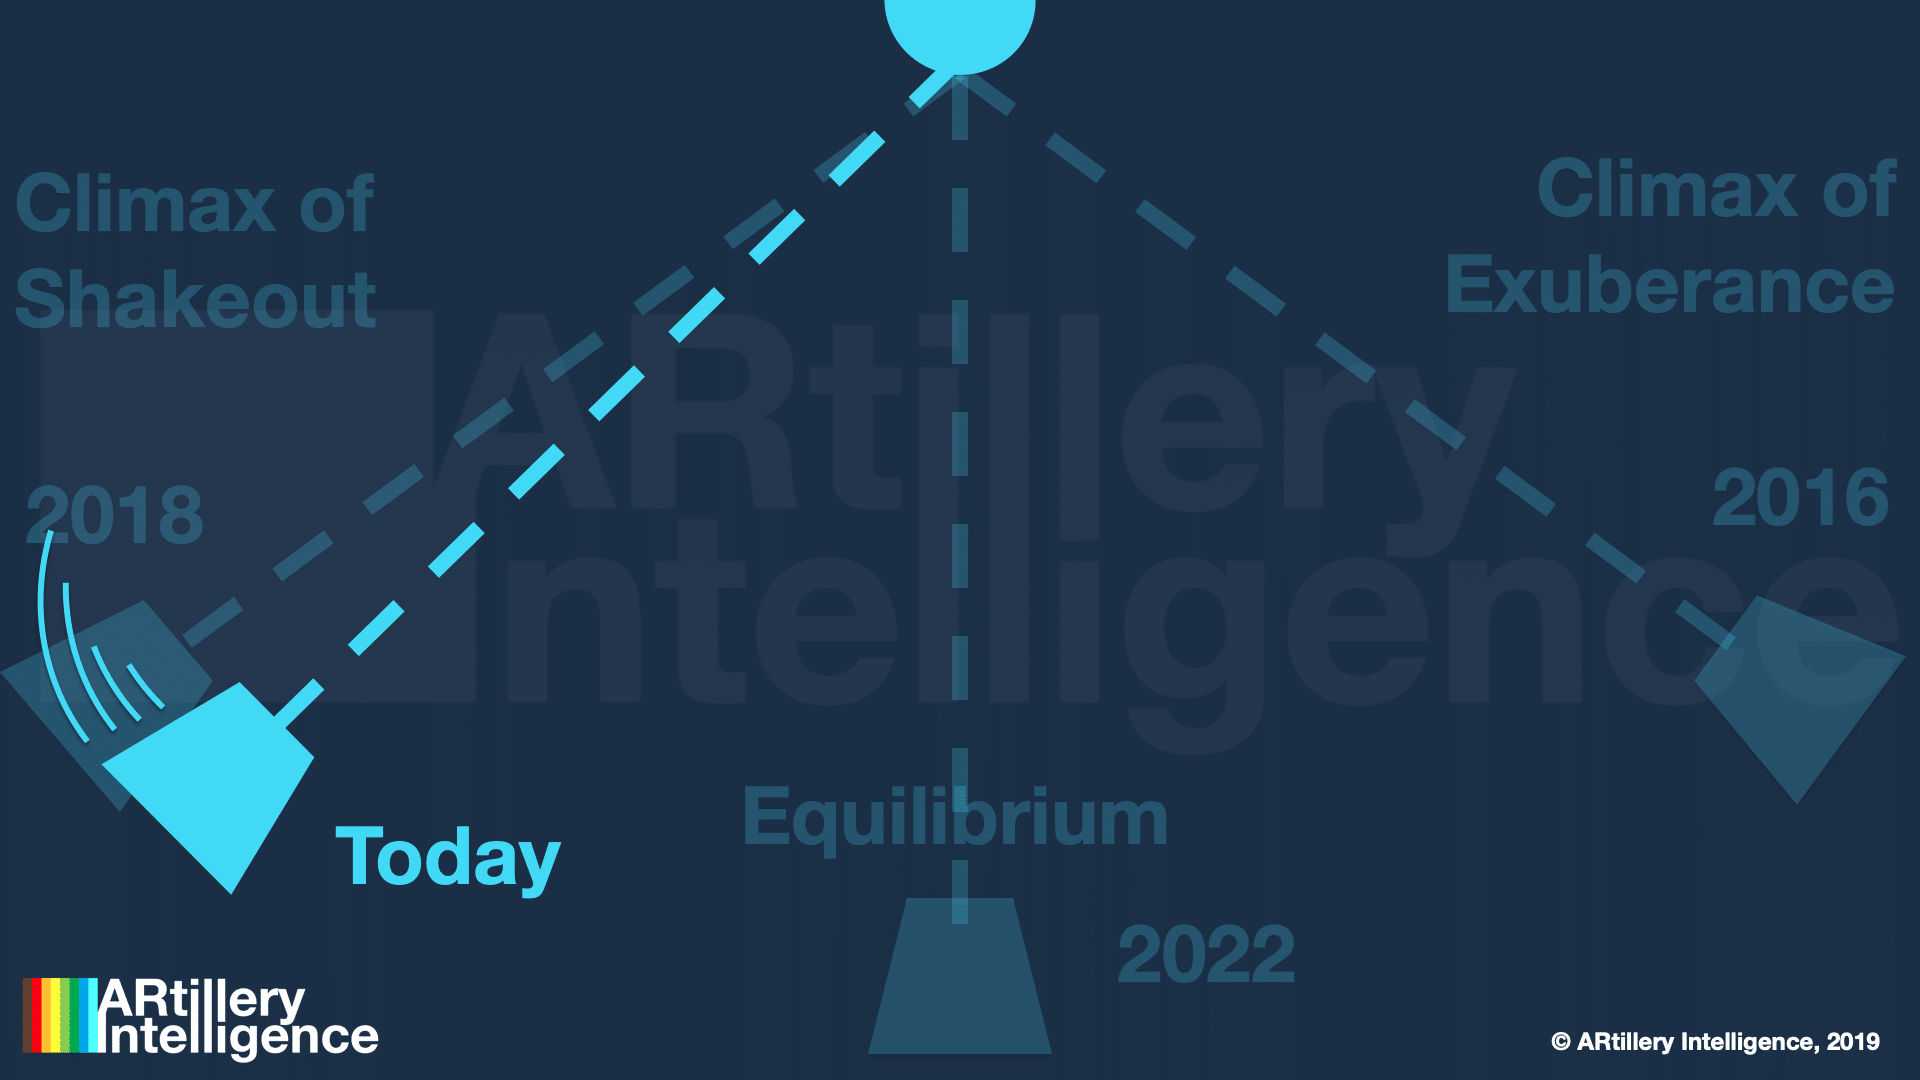
But after the backswing hits its peak, things move towards a happy medium. Markets then progress at a healthy pace, while supply and demand grow in step, albeit slowly. Just like gravity compels the pendulum to the center, market forces compel supply/demand equilibrium.
What follows is a more measured and realistic period of market growth. The previous hockey-stick growth charts give way to slower, but more reliable, industry revenue projections. Our research arm ARtillery Intelligence’s recent AR and VR forecasts characterize this.
History Repeats?
A historical example is the 2000’s dot-com bubble. We saw overblown expectations, followed by a backlash/recessionary period. But then around 2002, things moved (slowly) towards measured progress, and the rise of giants like Google, Facebook, and the web 2.0 movement.
Though AR’s boom, bust and recovery is likely on a smaller scale, the question is if it follows that pattern… and where we are now. There are some confidence signals that the worst is behind us and we’re in that 2002-ish sweet spot where the pendulum is returning to its center.
What are those confidence signals? The highlight reel includes tech giants’ massive investments in AR platforms; brand advertising dollars flowing into AR lenses; in-app consumer spending in AR gaming; and of course Apple’s looming AR glasses that could accelerate the sector.
We’ll be watching closely and will report back on all the signals the AR market reveals in 2020 — the good the bad and the ugly (hopefully not too much ugly). Meanwhile, you can see NextReality’s full rankings below and it’s fleshed out list of company info here.
#25 — Eyecandylab ($1.5 Million)
#24 — DeepMotion ($2.2 Million)
#23 — Medivis ($2.3 Million)
#22 — LIV ($2.6 Million)
#21 — WarDucks ($3.8 Million)
#20 — Upskill ($7.6 Million)
#19 — Scape ($8 Million)
#18 — Scope AR ($9.7 Million)
#17 — Emerge ($12 Million)
#16 — Waveoptics ($13 Million)
#15 — Nreal ($15 Million)
#14 — Augmedix ($19 Million)
#13 — ThreeKit ($20 Million)
#12 — Prophesee ($28 Million)
#11 — Light Field Lab ($28 Million)
#10 — CTRL-Labs ($28 Million)
#9 — North ($40 Million)
#8 — Matterport ($48 Million)
#7 — Mojo Vision ($58 Million)
#6 — DigiLens ($50 Million)
#5 — RealWear ($80 Million)
#4 — Vayyar ($109 Million)
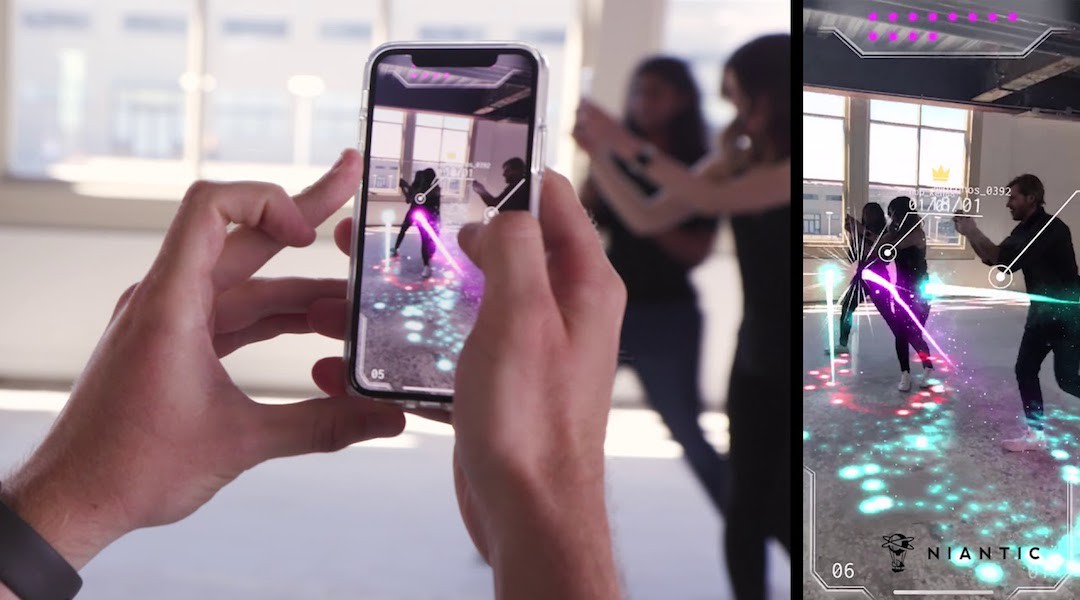
#3 — Niantic ($245 Million)
#2 — Corning ($250 Million)
#1 — Magic Leap ($280 Million & counting)
* Some companies are more “AR” than others in terms of the degree the technology drives their core businesses. AR is core to Digilens and Magic Leap, more so than Corning and Matterport. This doesn’t invalidate the list but should be acknowledged in any strategic takeaways.
For deeper XR data and intelligence, join ARtillery PRO and subscribe to the free AR Insider Weekly newsletter.
Disclosure: AR Insider has no financial stake in the companies mentioned in this post, nor received payment for its production. Disclosure and ethics policy can be seen here.
Header Image Credit: Magic Leap