

This is the latest in AR Insider’s Campaign Tracker series. Running semi-weekly, it examines marketing campaigns that utilize AR visualization such as product try-ons, and their results. For a full list of campaigns, comparative ROI chart and deeper analysis, subscribe to ARtillery PRO.
Proof points continue to roll out for AR’s effectiveness in boosting product purchases. Early-adopter brands are learning that AR lets them demonstrate products in immersive ways. That can include brand engagement (upper-funnel) or “try before you buy” (lower-funnel) visualization.
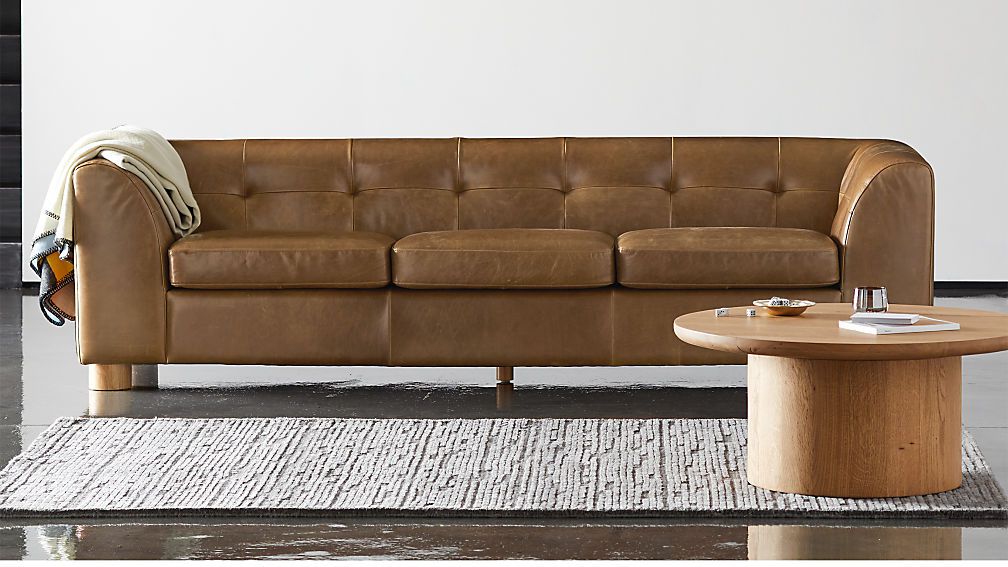
The latest evidence from the lower-funnel side of the AR commerce spectrum is a CB2 campaign. The millennial-focused furniture retailer worked with Vertebrae to help customers visualize furniture through AR on their smartphones. The functionality was added to its mobile website.
This kicked off with CB2’s menswear-inspired GQ furniture line but will expand to 650 other pieces in its inventory by year-end. This involves a heavy process of digitizing large items, which it will continue to do as fast as it can — an ongoing challenge in digitizing extensive product catalogs.
But CB2 is motivated to get there, based on the validation it already sees. Vertebrae’s preliminary data shows that products visualized through the AR feature saw 7 percent average conversion boosts, 21 percent greater revenue per visit, and 13 percent greater average order value.

Transferrable Lessons
In examining how CB2 achieved the above performance metrics, it’s partly due to AR’s inherent ability to engender more informed consumer purchases. But there are a few other tactics it applied that are worth extracting in terms of best practices and transferrable lessons.
For one, it’s notable that CB2 chose web AR as a vessel as opposed to an AR app (or AR feature within its app). The thought is that AR is too early and unproven to justify typical app friction. AR’s need for a quick & dynamic experience is better aligned with the mobile web’s easier access.
Moreover, CB2 did its homework to determine that web AR is more aligned with how its customers specificaly engage — both at home and in-store. Specifically, CB2’s VP of marketing Samie Barr told FurnitureToday that half the site’s traffic comes from mobile web users.
Launching and testing AR with the GQ product line was also deliberate. CB2’s research showed that the furniture line’s male target audience generally has less familiarity with interior design or space planning. In other words, it’s a good product/market fit for AR visualization.
AR Advertising vs. Marketing
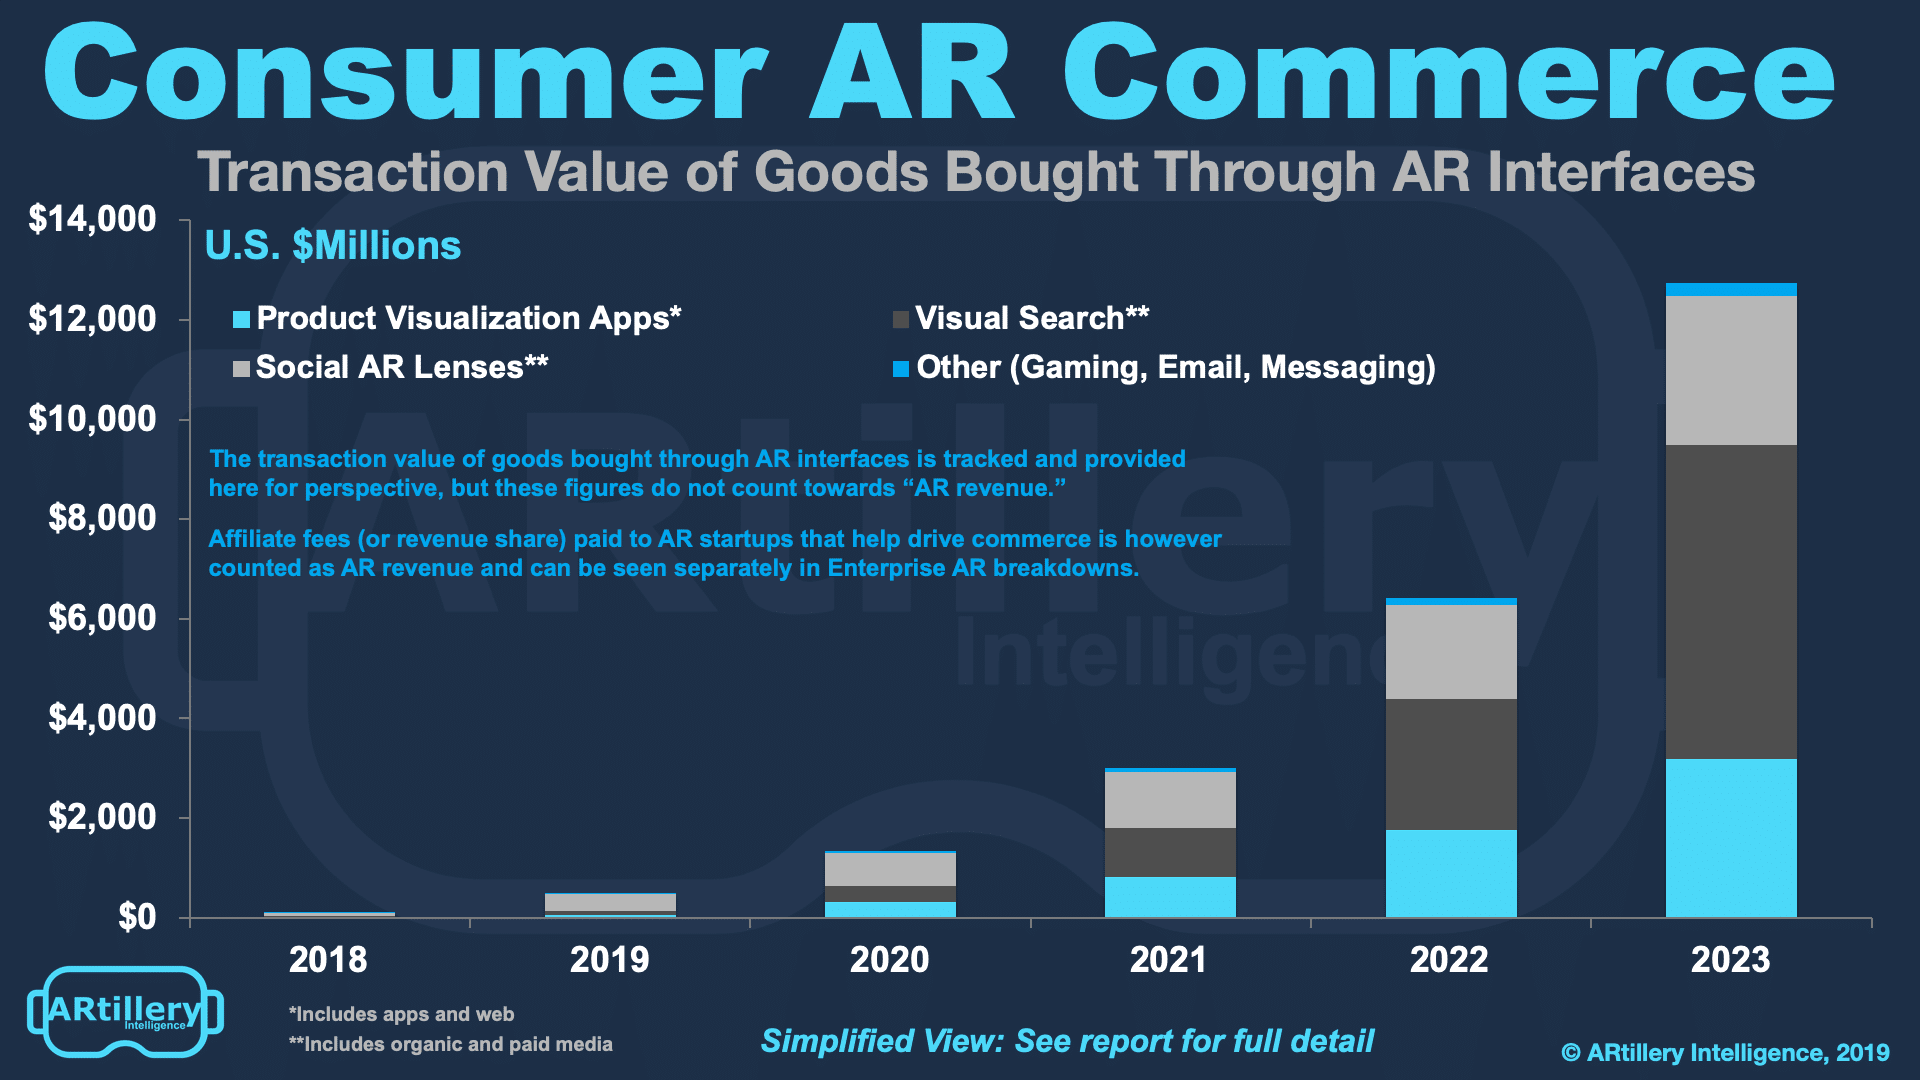
CB2’s ROI evidence joins others that should continue to validate and accelerate AR adoption among consumer brands. Based on this momentum, our research arm ARtillery Intelligence projects the transaction value of goods purchased through AR will grow to $12.7 billion by 2023.*
This notably includes AR in both advertising and marketing. Those two things sound the same — and have the same intended outcomes — but are different. Advertising involves paid media placement while marketing is broader brand promotion such as email, apps and websites.
That translates to brand AR activations in a variety of ways. Sponsored lenses on Snapchat or Facebook are advertising because brands pay for distribution and targeting on those social graphs. AR visualization within a brand’s own app or site, such as Houzz or CB2, is marketing.
The difference is not that big, except to market watchers like us that put things in buckets for the sake of accurate market sizing. What matters more is that AR strategies can be similar between the two paths, with some differences in distribution and audience targeting per the above.
Flavors of AR Commerce
It’s also worth noting that CB2’s campaign involves rear-facing camera AR. Most AR traction we’ve seen is for front-facing AR (sunglasses, cosmetics), but the broader canvas of the physical world is a larger opportunity. That’s cars and couches today but could expand significantly.
This front versus rear-facing camera delineation makes two key differences in AR categorization raised in this article — the other being advertising versus marketing. That double bisection begs for a 2×2 table for continuing to categorize and draw lessons from AR commerce (stay tuned).
We’ll be back with more AR commerce proof points and takeaways in our Campaign Tracker series. There will be lots to watch and internalize as AR commerce evolves quickly from early and experimental stages to a firmer set of strategies around UX, user targeting, and distribution.
*The transaction value of consumer goods bought through AR interfaces is tracked in the above figures but don’t count towards “AR revenue.” More inclusions and exclusions are specified here.
For deeper XR data and intelligence, join ARtillery PRO and subscribe to the free AR Insider Weekly newsletter.
Disclosure: AR Insider has no financial stake in the companies mentioned in this post, nor received payment for its production. Disclosure and ethics policy can be seen here.