
“Behind the Numbers” is AR Insider’s series that examines strategic takeaways from the original data of its research arm, ARtillery Intelligence. Each post drills down on one topic or chart. Subscribe or login to access the full library of data and reports.
How do consumers feel about VR? Who’s using it? What devices and apps do they prefer? And what do they want to see next? Similarly, what are non-users’ reasons for disinterest? And how can VR software developers and hardware players optimize product strategies accordingly?
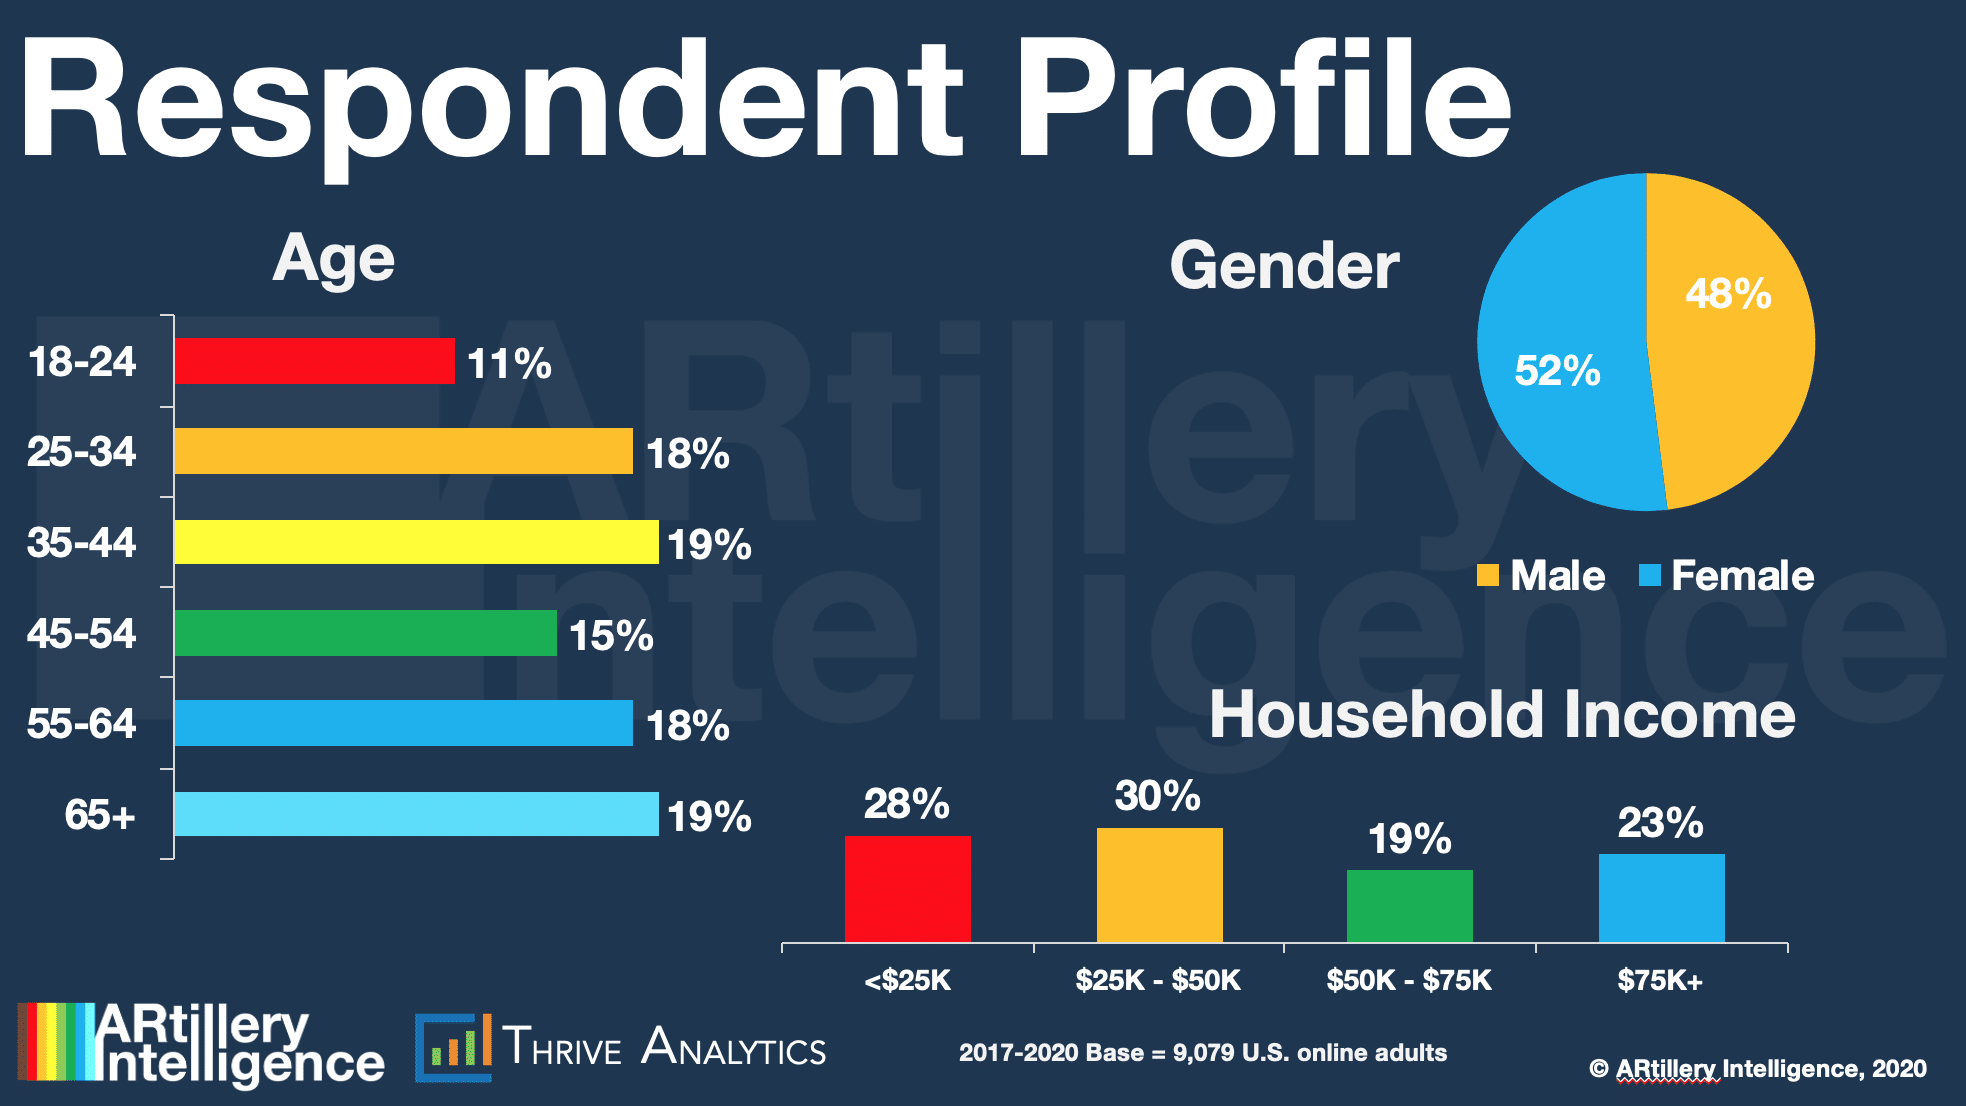
These are key questions at VR’s early stages. Working closely with Thrive Analytics, AR Insider’s research arm ARtillery Intelligence wrote questions to be presented to more than 1,000 U.S. adults in Thrive’s established consumer survey engine. And the result is a new narrative report.
Known as VR Usage & Consumer Attitudes, Wave IV, it follows similar reports over the last several years. Four waves of research now brings new insights and trend data to light. And all four waves represent a collective base of 9,079 U.S. adults for robust longitudinal analysis.
So what did they find out? At a high level, 19 percent of consumers surveyed have bought or used a VR headset, up from 16 percent in 2019. VR users also indicate high satisfaction; upward-trending usage frequency; and price sensitivity that aligns with current pricing trends.
VR Users: the How Many?
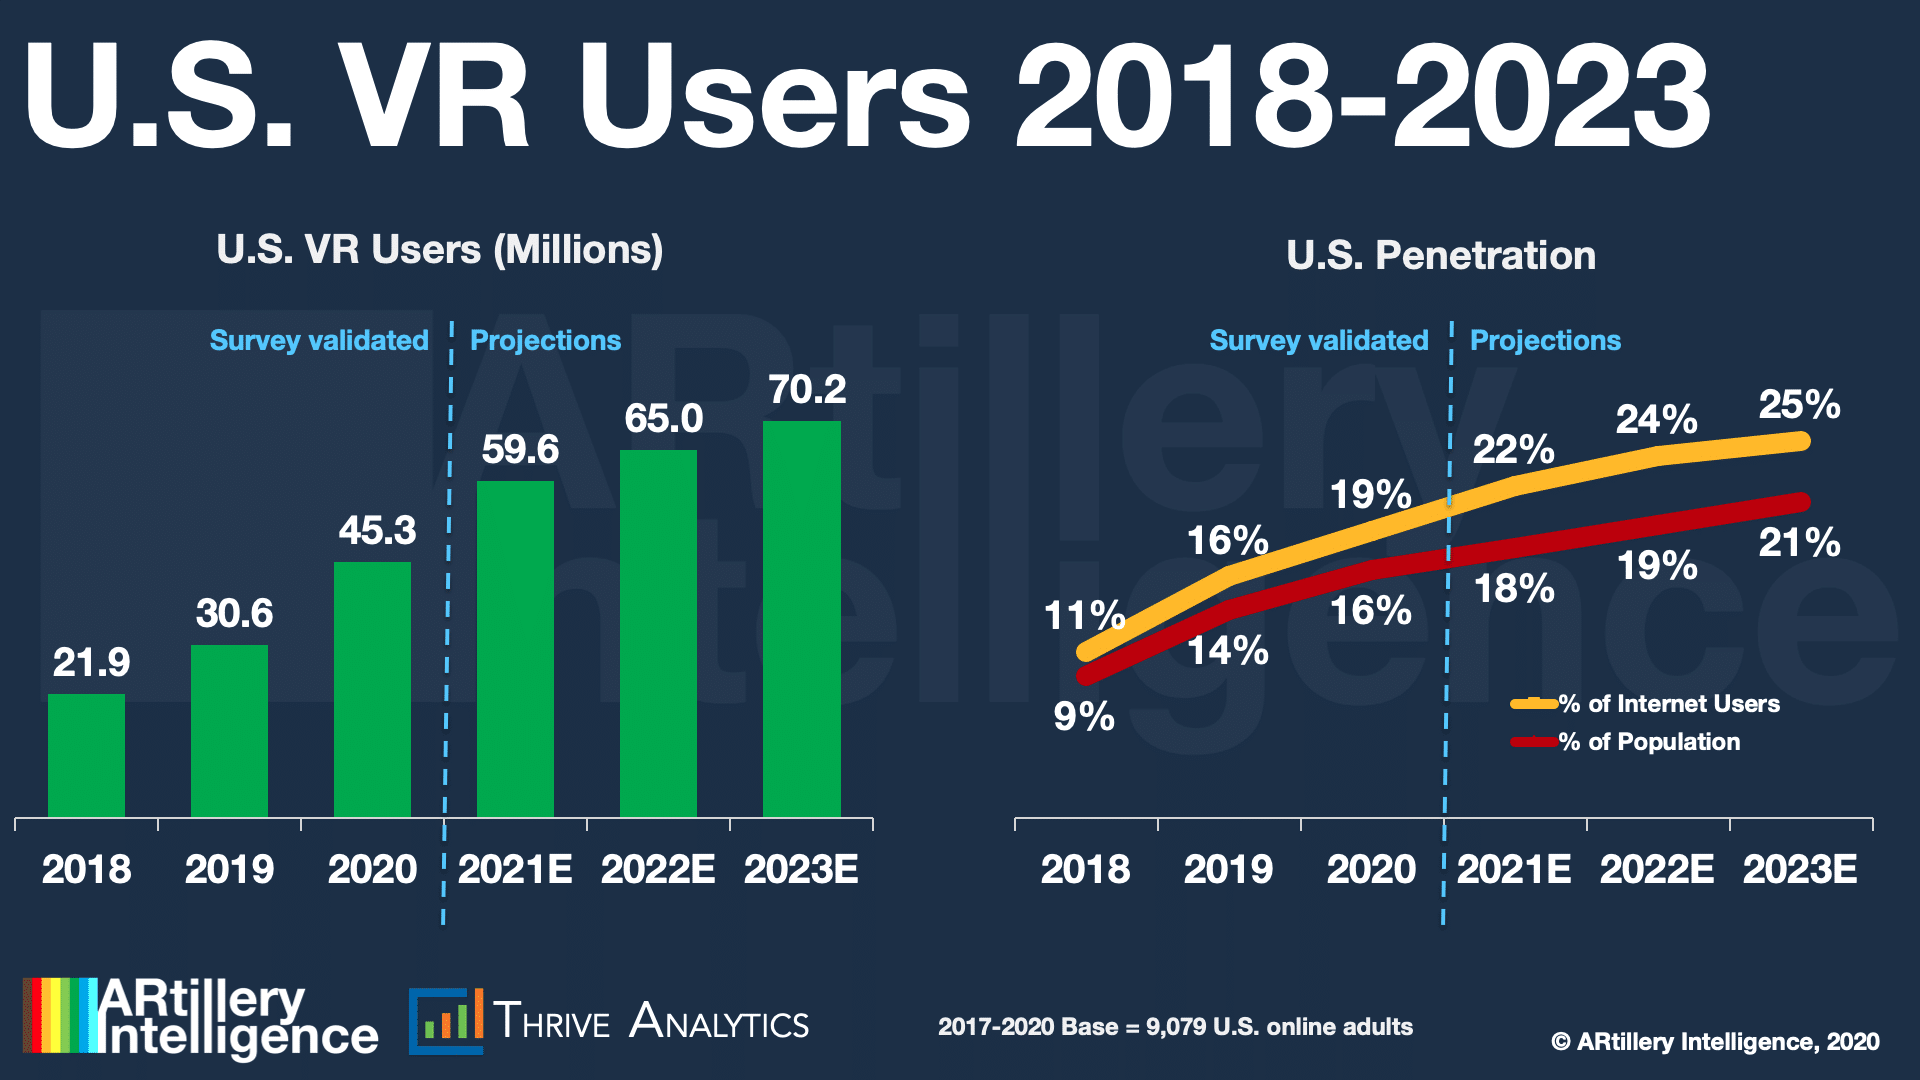
Starting at the top, what’s VR’s consumer penetration? As noted, survey results indicate that it currently stands at 19 percent. This aligns with headset penetration figures reported in ARtillery’s Global VR Forecast (though this survey is U.S. centric) and is up from 16 percent in 2019.
Applying that percentage to the total U.S. adult population yields a base of 45.3 million users, up from 30.6 million in 2019. This is different than the total installed base of VR headsets in market. The latter is a smaller figure, examined later in this report, due to multiple users per headset.
Speaking of signals, the report projects VR to reach 70.2 million users by 2023, which will be 25 percent of internet users at the time. These projections stem from three years of survey data, trendline analysis and other factors such as historical growth comparisons and sales momentum.
Frequency: the How Often?
Perhaps more important than the number of users, a key variable in tracking success in any digital media is frequency. Because VR adoption barriers can be high (set up, cost, technological invasiveness, etc.), the name of the game is to design for ease of use and replayability.
This challenge is being addressed with the advent of standalone headsets like Oculus Quest. Given its ease of use and growing penetration, we believe frequency metrics will improve over time. Meanwhile, VR frequency already shows positive momentum in these survey results.
Specifically, most VR users engage monthly (31 percent) followed by weekly (27 percent) and daily (20 percent). This means that 78 percent of users activate monthly or more, while 22 percent do so monthly or less. This compares favorably to other consumer tech like (most) mobile apps.
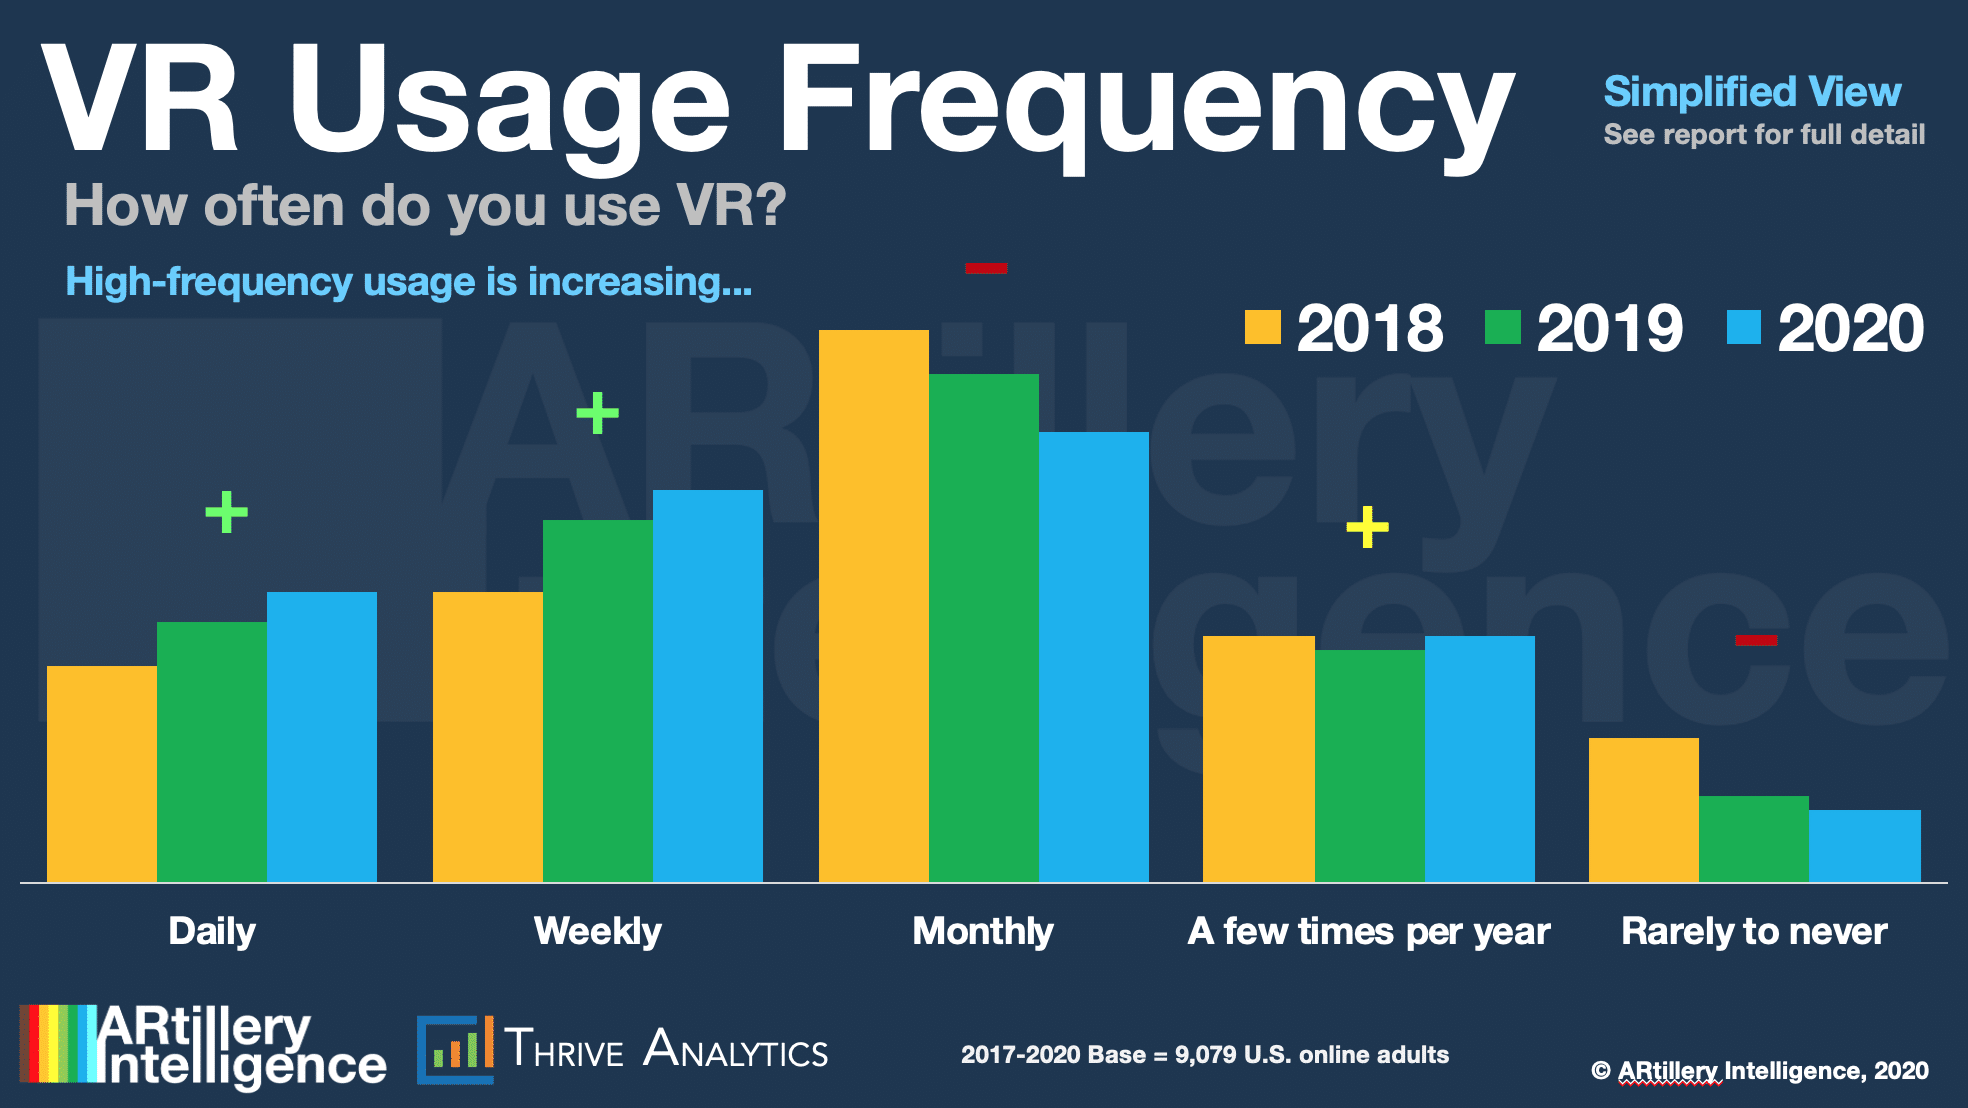
As for year-over-year trending, daily and weekly usage are up two percentage points each. Monthly usage is down four points. This shows that users are engaging more often – at daily and weekly levels rather than monthly, possibly due to more standalone headsets in-market this year.
As noted, standalone headsets like Oculus Quest and Vive Focus reduce friction. Among other things, this should increase usage frequency, already seen in this survey. Positive momentum is impacted by Quest’s limited time in the market, and will only improve with more tenure.
We’ll be back with more report excerpts and tidbits. Meanwhile, check out the full report here.