
Though spatial computing and all its subsegments continue to hold great potential, they also face headwinds. Factors holding them back include challenged technological advancement and cultural adoption. However, bright spots include the rise of AI-powered smart glasses.
For example, as seen in Meta’s earnings, smart glasses have offset declines in other subsegments, such as consumer VR. Altogether, it’s a mixed story with both positive and negative drivers. The good news is that the positives will mostly outweigh the negatives in the near term.
To wrap some numbers around these claims, spatial revenue is projected to grow from $28.5 billion in 2025 to $61.4 billion in 2030. That’s steep growth, driven by a projected inflection next year as new smart glasses blitz the market from Apple, Meta, Google (AndroidXR), and others.
What else is driving revenues, and what are strategic implications? These questions are tackled in the latest spatial revenue forecast from our research arm, ARtillery Intelligence. This Behind the Numbers series excerpts insights, continuing here with enterprise spending estimates.
Immersive Productivity
After the last installment of this series looked at consumer spending in XR – today and projected forward – we switch gears in this installment to dive into enterprise spending. We’re talking about XR hardware and software to support productivity for enterprise end-users.
Revenue in this category is projected to grow from U.S. $11.9 billion in 2025 to U.S. $17.58 billion in 2030, an 8.09 percent compound annual growth rate (CAGR). This includes XR hardware/headsets (mobile devices are excluded in mobile AR calculations) and software/apps.
In all cases, we’re talking about B2B spending. The key term was noted above: enterprise end users. The above revenue totals don’t include B2B2C spending such as enterprise development and distribution of consumer XR, which we’ll examine in the next installment of this series.
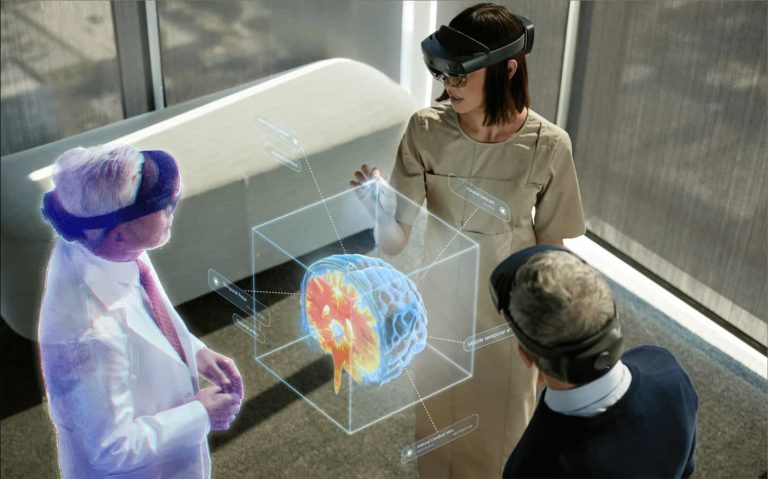
As for applicability and use cases, we’re mostly talking about immersive productivity such as data visualization and design collaboration. XR is also fitting in immersive training, where VR’s levels of sensory immersion boost memory recall in areas such as retail, healthcare, and industrial.
AR meanwhile has broader applicability in industrial settings due to its real-world presence. Use cases include line-of-sight guidance – either live/remote or pre-authored support. These AR functions breed operational efficiencies such as greater speed and fewer errors and “rework.”
Much of the above ROI is realized on micro levels, such as reducing operational expenses. But benefits also materialize on macro levels such as disseminating institutional knowledge and upskilling novice workers faster. This can do things like alleviate the dreaded industrial skills gap.
Zero-Cost Hardware
Zeroing in on XR software spending, it follows enterprise software models, including SaaS-based recurring cycles. Because these outpace hardware replacement cycles – and due to orbiting spending like device management programs – enterprise XR software eclipses hardware spend.
Meanwhile, yet another delineation in enterprise XR is headworn versus handheld. The former is often more effective due to its line-of-sight and hands-free orientation. But mobile AR shows greater traction as it occurs on zero-cost hardware – the sunk-cost device you already own.
For that same reason, it’s important to note that mobile AR device sales aren’t counted in the revenue figures above – only software. This is another reason software spending outweighs hardware spending in enterprise XR. The mobile AR portions of that spending are all software.
Beyond cost, smartphones have security and organizational advantages. For one, IT departments know and trust them… which can’t always be said for XR headsets. This makes mobile AR strong in enterprise IT support, such as field agents who are fed AR-guided reference material.
We’ll pause there and circle back in the next Behind the Numbers installment with more numbers & narratives. Meanwhile, check out the full report.