
“Behind the Numbers” is AR Insider’s series that examines strategic takeaways from the original data of its research arm, ARtillery Intelligence. Each post drills down on one topic or chart. Subscribe or login to access the full library of data and reports.
Industry rhetoric about AR’s world-changing status outweighs tangible evidence that it’s captivating consumers today. Though we see some evidence, such as lens engagement figures from Snapchat and others, we’re mostly flying blind when it comes to consumer AR sentiment.
Looking to fill that gap, AR Insider’s research arm ARtillery Intelligence has completed Wave III of its annual consumer survey report. Working with consumer survey specialist Thrive Analytics, it wrote questions to be fielded to 1000 U.S. adults and produced a report based on the results.
Known as AR Usage & Consumer Attitudes, Wave III, it follows similar reports over the last few years. Three waves of research now bring new insights and trend data to light. And all three waves represent a collective base of 6,135 U.S. adults for robust longitudinal analysis.
Among the topics: How is mobile AR resonating with everyday consumers? How often are they using it? How satisfied are they? What types of experiences do they like most? How much are they willing to pay for it? And for those who aren’t interested in mobile AR… why not?
Starting at the Top…
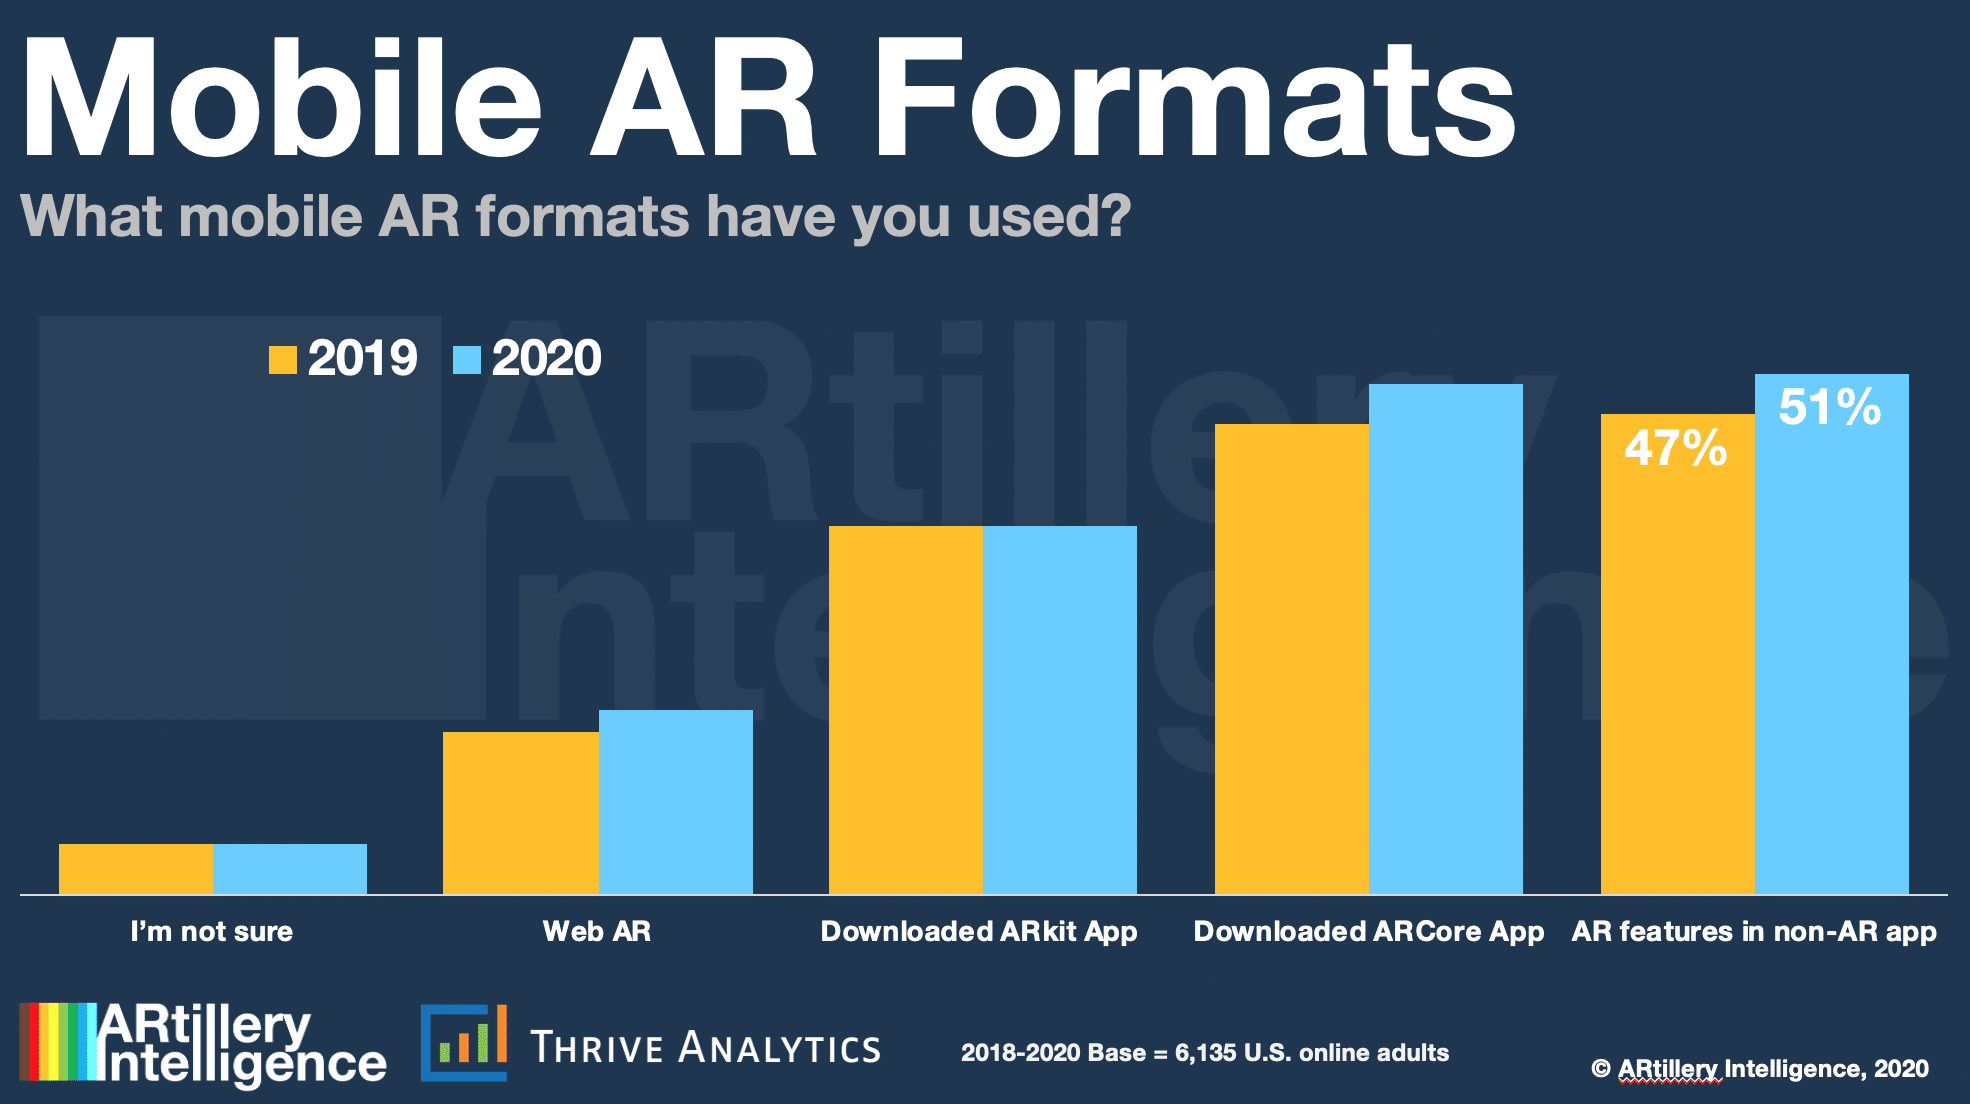
Starting at a high level, how and in what formats are AR users consuming the experience? Apps? web? AR features in non-AR apps? Given that Apple and Google’s AR developer kits (ARkit and ARCore) have democratized mobile AR, their apps scored high in terms of usage.
Specifically, 50 percent of AR users report using ARCore apps while 36 percent report using ARkit apps. This is surprising due to these platforms’ respective market shares. Though ARCore will eventually reach a larger Google Android base, ARKit has more compatible devices today.
But more interesting is what lies beyond these platforms. As we’ve examined, apps aren’t the best vessel for AR, given download friction and other dynamics. That leaves two formats seen in these results – one that’s already a leading AR format, and one that’s emerging.
The single leading format in this survey (51%) is what we call “AR-as-a-feature.” This lowers adoption barriers by planting AR functionality within already-well traveled apps. In fact, the most popular flavors of AR to date – Pokémon Go and Snapchat Lenses – constitute AR-as-a-feature.
The second area is Web AR. These are AR experiences delivered in the mobile browser. Because AR is still early and unproven, there’s little motivation for consumers to go through the typical friction of downloading apps. Web AR can be shared and activated with just a web link.
Web AR still has some quality and capability deficiencies compared to native apps, but that’s quickly changing due to the work of innovative startups like 8th Wall and others.
Drilling Down…
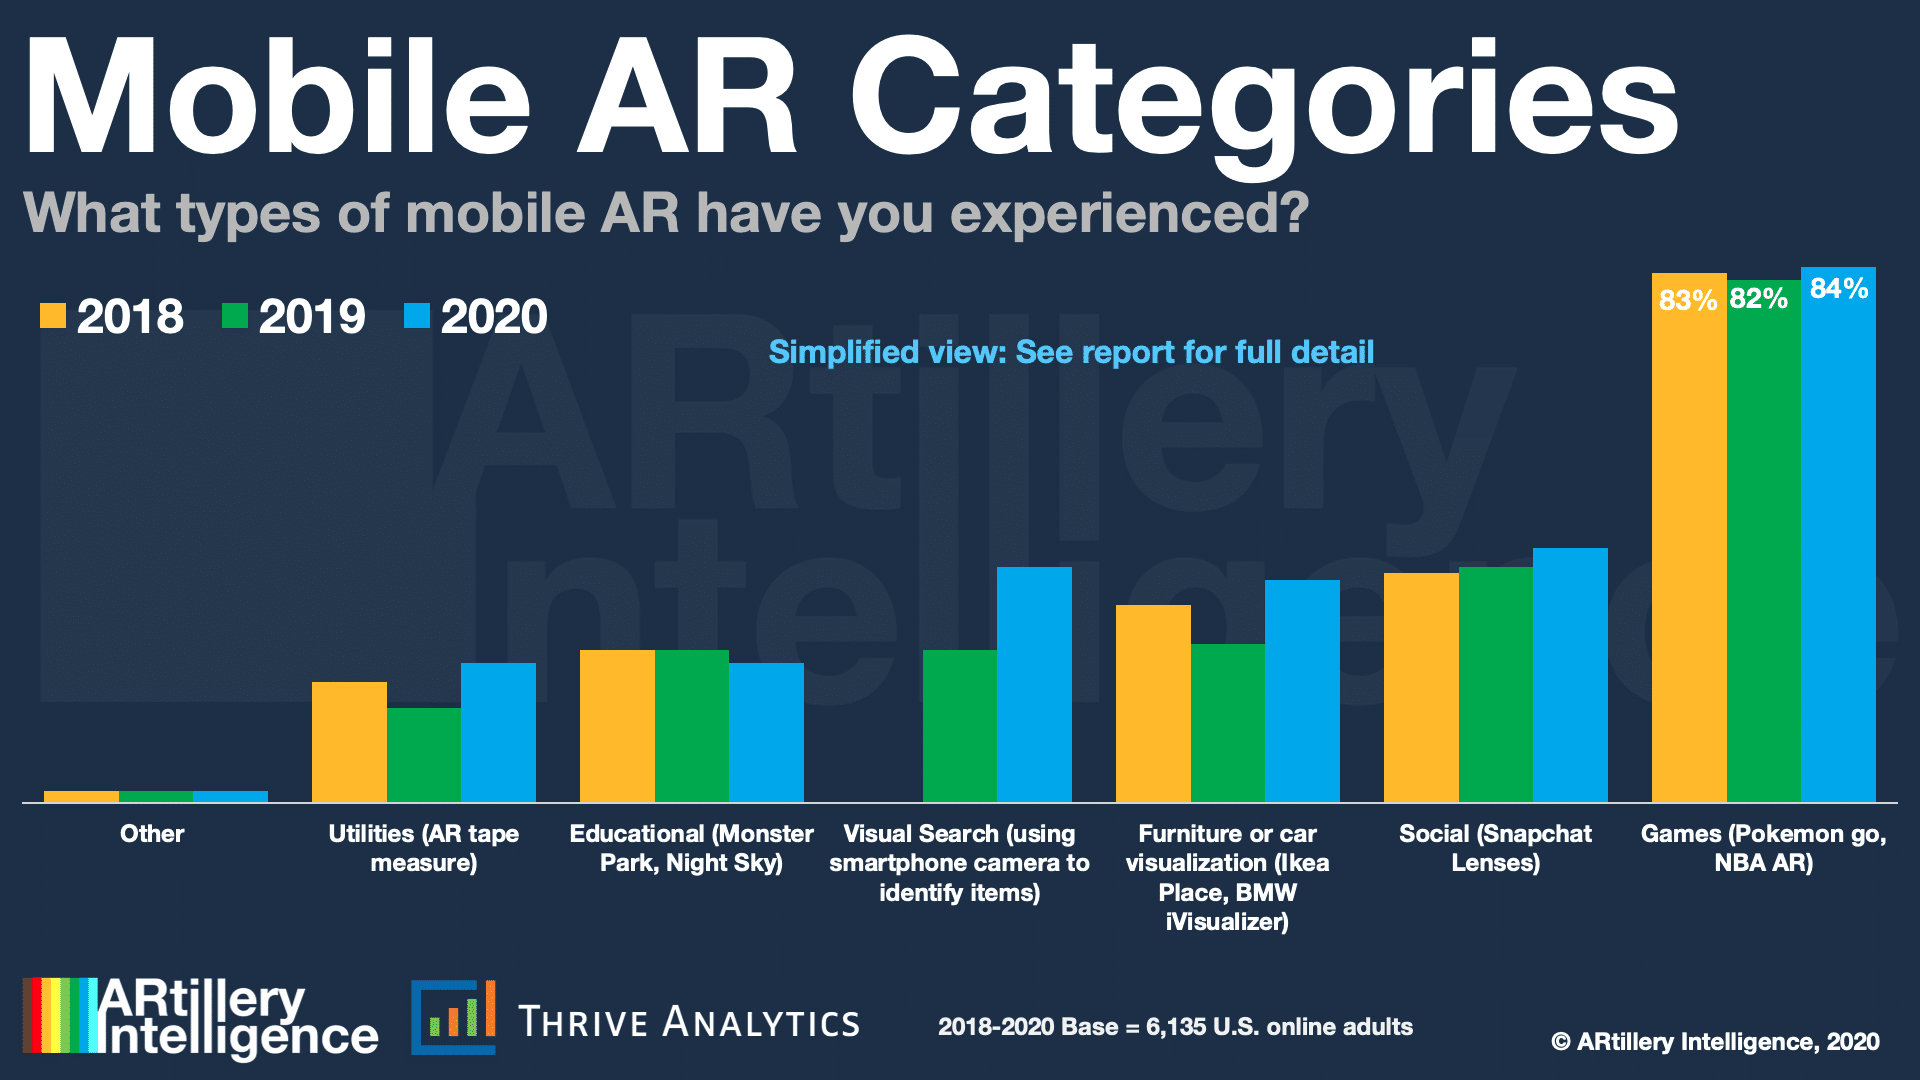
Drilling down one level, what content categories are mobile AR users engaging most? As mentioned, the most popular flavors of AR so far are Pokémon Go and Snapchat Lenses. So naturally, the survey results peg gaming (84 percent) and social (40 percent) as top categories.
As a matter of process and methodology, we should mention here that these experiences are named as examples when asking survey respondents about the corresponding categories. In order to avoid false positives, it’s always good to be very specific in survey questionnaires.
While we’re at it, we’ll address another looming question: Is Pokémon Go AR? Many purists argue that it’s not. Our take has always been that any graphical, audible or geographically- contextual augmentation (the latter relevant to Pokémon Go) aligns with the definition of AR.
As for specific success factors, Pokémon Go has an optimal mix of game mechanics, challenging play and contextual augmentation. In fact, after receding from its 2016 peak, the game returned to prominence and consumer traction with 2019 as its most successful year to date.
As for social AR lenses, success factors include simple activation and virality. There’s also a whimsical element, amplified by a social-graph driven network effect and virality. This has caused Snapchat to reach 163 million daily AR users and strong revenue growth from paid AR lenses.
Inherently Monetizable
But most notable among these AR category results is the year-over-year jump for visual search. It grew from 24 percent of users in Wave II to 36 percent in Wave III. This aligns with something we’ve been signaling for a while: AR growth will start to come from high-frequency utilities.
To expand on that, visual search’s “all-day” potential flows from its versatility and broad application… just like search itself but with the physical world as its canvas. The ability to pull out your phone and identify items can happen in lots of daily contexts and will continue to grow.
To acknowledge other fast-moving AR categories, product visualization grew from 25 percent in Wave II to 35 percent in Wave III. Though less frequent, product visualization apps like IKEA Place can save consumers time and headaches through more informed product purchases.
What’s also notable about visual search and product visualization is that they’re inherently monetizable. There’s a high-intent “lower-funnel” use case involved (similar to web search) when someone actively seeks more context around products in such a visually immersive way.
We’ll be back with more report excerpts and tidbits. Meanwhile, check out the full report here.