
Though spatial computing and all its subsegments continue to hold great potential, they also face headwinds. Factors holding them back include challenged technological advancement and cultural adoption. However, bright spots include the rise of AI- powered smart glasses.
For example, as seen in Meta’s earnings, smart glasses have offset declines in other subsegments, such as consumer VR. Altogether, it’s a mixed story with both positive and negative drivers. The good news is that the positives will mostly outweigh the negatives in the near term.
To wrap some numbers around these claims, spatial revenue is projected to grow from $28.5 billion in 2025 to $61.4 billion in 2030. That’s steep growth, driven by a projected inflection next year as new smart glasses blitz the market from Apple, Meta, Google (AndroidXR), and others.
What else is driving spatial revenues, and what are strategic implications? These questions are tackled in the latest spatial revenue forecast from our research arm, ARtillery Intelligence. This Behind the Numbers series excerpts those insights, continuing below with top revenue drivers.
Spatial Computing Revenue Forecast, Q1 2026
Spatial Spectrum
As noted, global spatial computing revenue is projected to grow from U.S. $28.5 billion in 2025 to U.S. $61.4 billion in 2030. This represents a 16.56 percent compound annual growth rate (CAGR), which is fairly steep. So what’s driving XR revenues? Some subsets are doing better than others.
Specifically, we subdivide revenue totals into three categories: mobile AR, headworn AR, and VR. Those top-level segments then branch into several subdivisions such as device tiers as well as consumer and enterprise spending. Altogether, it’s a matrix of revenue categories.
Starting with top-level subdivisions, VR leads in revenue today ($14.02 billion in 2025) as it’s more established than the other segments. However, it’s not where the momentum lies (more on that in a bit). Its top revenue category is enterprise spending, driven by immersive training.
On the consumer end, the VR market is driven by Meta’s investments in R&D and loss leader pricing, which bring value to devices like Quest 3 and 3s. Both excel among VR headsets that feature high-definition color video passthrough (VPT), which in turn enables mixed reality.
How Many XR Devices Did Meta Sell in Q4?
Diverging Devices
All of that said, VR’s growth is decelerating and being outpaced by emerging formats like non-display AI glasses. This is why Meta has several balls in the air across the spatial spectrum. While it develops mixed reality and VPT, it simultaneously invests in optical see-through (OST).
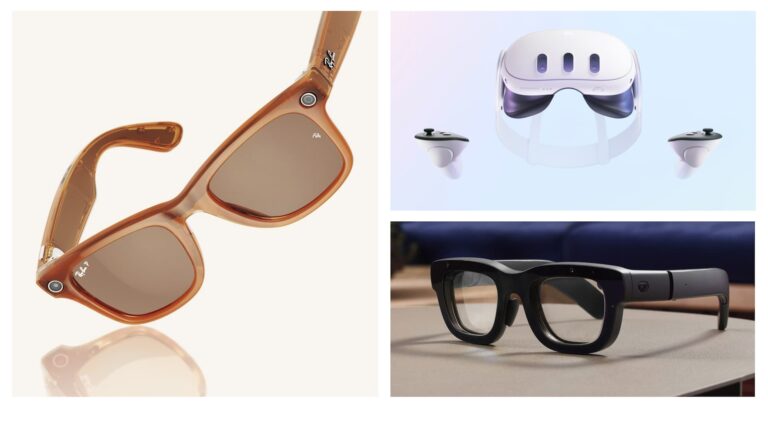
Starting with Ray Ban Meta Smartglasses (RMS), the rapid-growth device sidesteps AR displays in favor of AI-driven augmentation, delivered audibly. Meanwhile, Meta pursues the advanced end of the experiential spectrum with Orion – a prototype that teases visual AR’s endgame.
These two endpoints – today’s attainable reality and tomorrow’s AR moonshot – are bridged by Meta Ray-Ban Display Glasses (MRD*). These offer flat AR for messaging, notifications, and other utilities. This is a category that’s projected to inflect in 2027, driving XR’s steep CAGR.
Altogether, these various classifications of the spatial spectrum represent a key trend: the diversification of XR into purpose-built devices. This divergence of form factors will define the next few years of XR evolution, branching into form factors that map to specific use cases.
XR Lessons: Devices Diverge & Diversify
Zero-Cost Hardware
Moving on to the final top-level XR hardware category, mobile AR has been an early leader as it taps into a massive global installed base of smartphones. This is what we call zero-cost hardware because it utilizes the device that’s already in your pocket, thus lowering adoption barriers.
To wrap some numbers around that, mobile AR revenues were estimated to reach U.S. $9.02 billion last year (2025). Again, this piggybacks on 3 billion+ global smartphones, but to clarify, hardware spending (all those smartphones) aren’t included in the above revenue total.
So where is that $9 billion spent? Mobile AR’s top revenue categories include enterprise productivity and AR marketing & commerce. Notably, both of these revenue categories claim enterprises as buyers, though the latter has consumer-based endpoints (B2B2C).
That’s the thing with mobile AR. Though it has ample consumer traction – owing to those lowered adoption barriers – that doesn’t equate to revenue. To date, most consumer AR is brand sponsored rather than user purchased, though Snap’s Lens+ is starting to change that.
We’ll pause there and circle back in the next Behind the Numbers installment with more numbers & narratives. Meanwhile, check out the full report.